Financial Impact
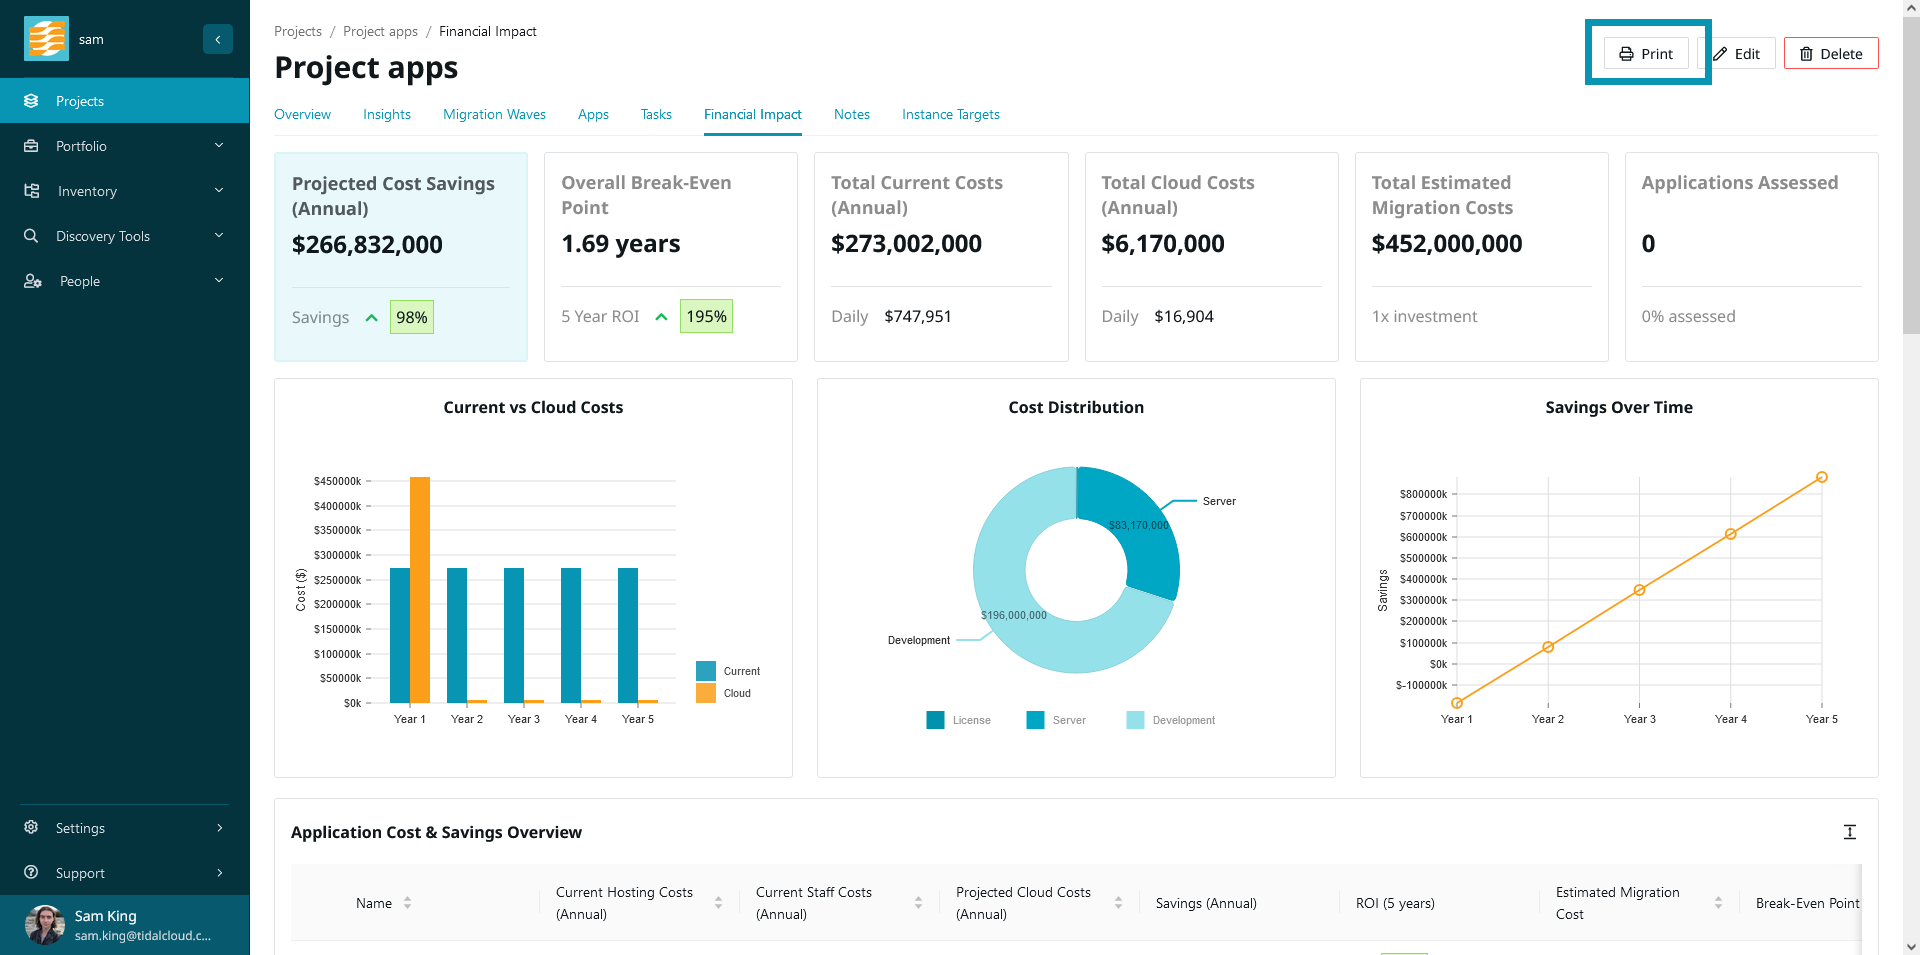
Tidal Accelerator empowers you to construct a compelling business case by visualizing the financial impact of your project. You can find your financial impact report by navigating to a project and clicking the ‘Financial Impact’ tab.
Financial Impact Overview
Tidal’s financial impact reports are generated based on projects. If you haven’t set up a project before, you can check out our guide on setting up an assessment project.
Your financial impact report can be divided into two parts. The first is the project-wide overview, which includes summaries and visuals for the entire project.
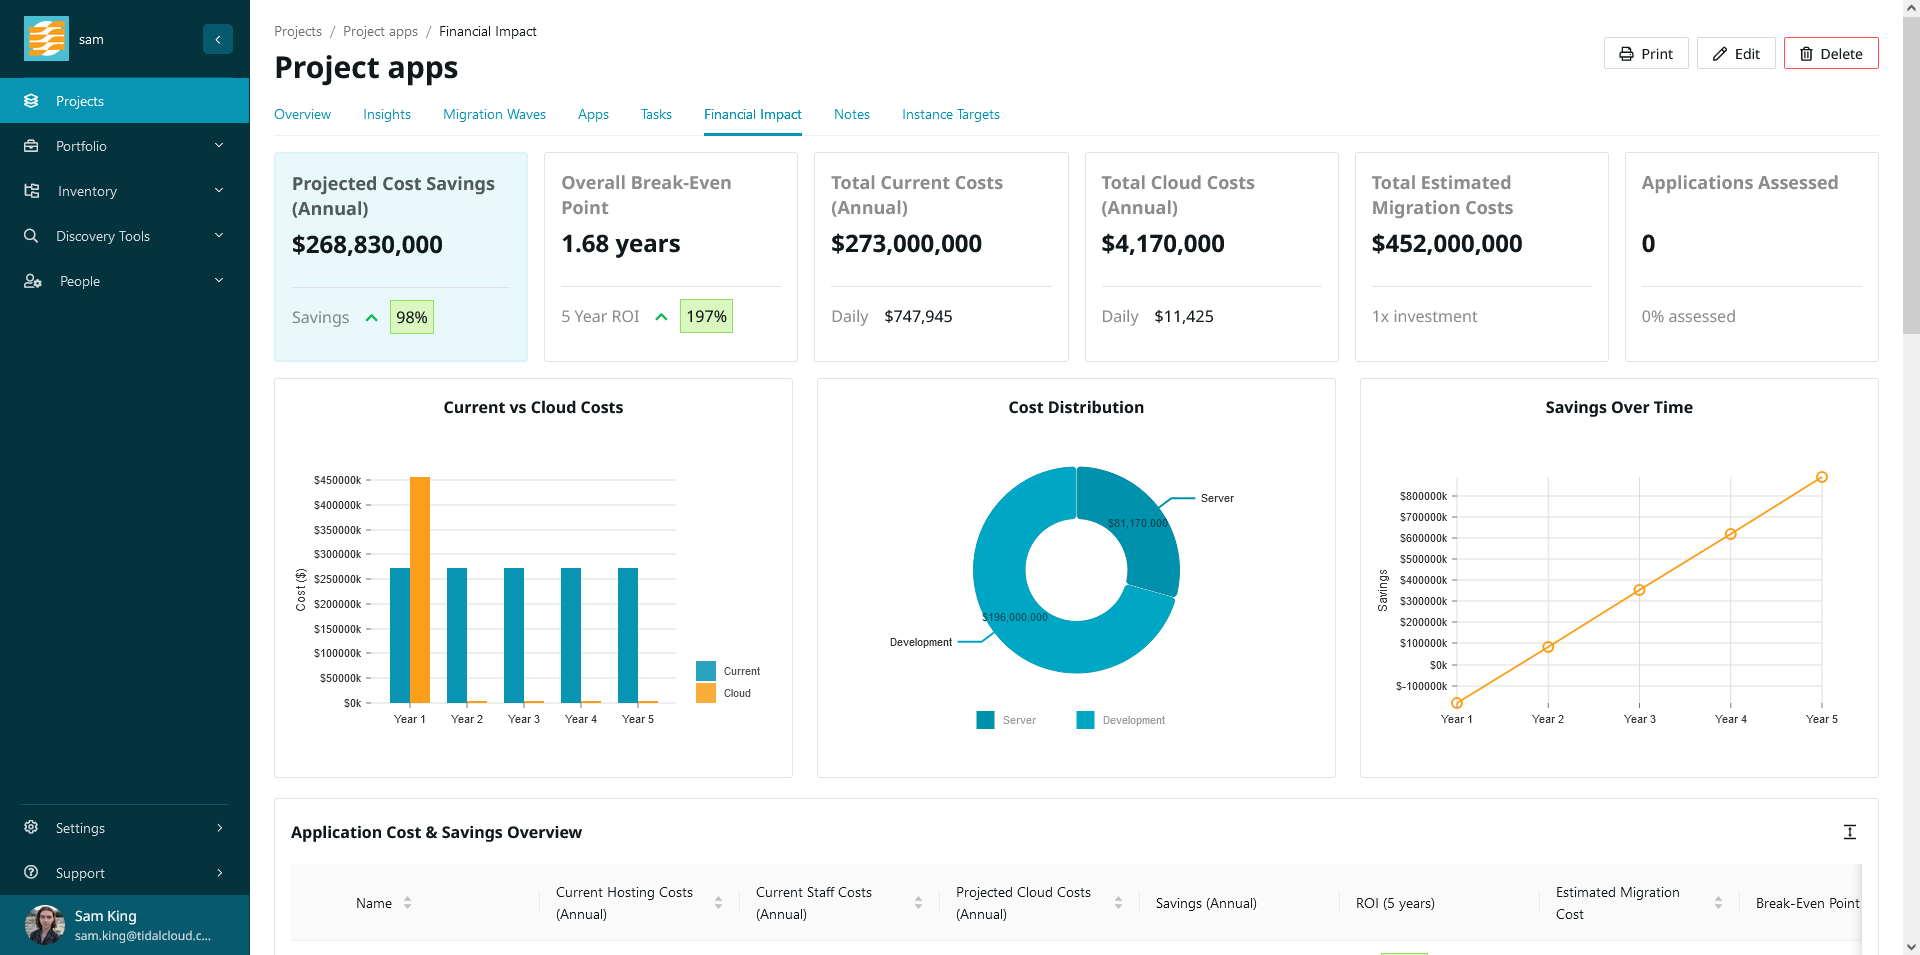
The second is a drill-down section for each application in this project.
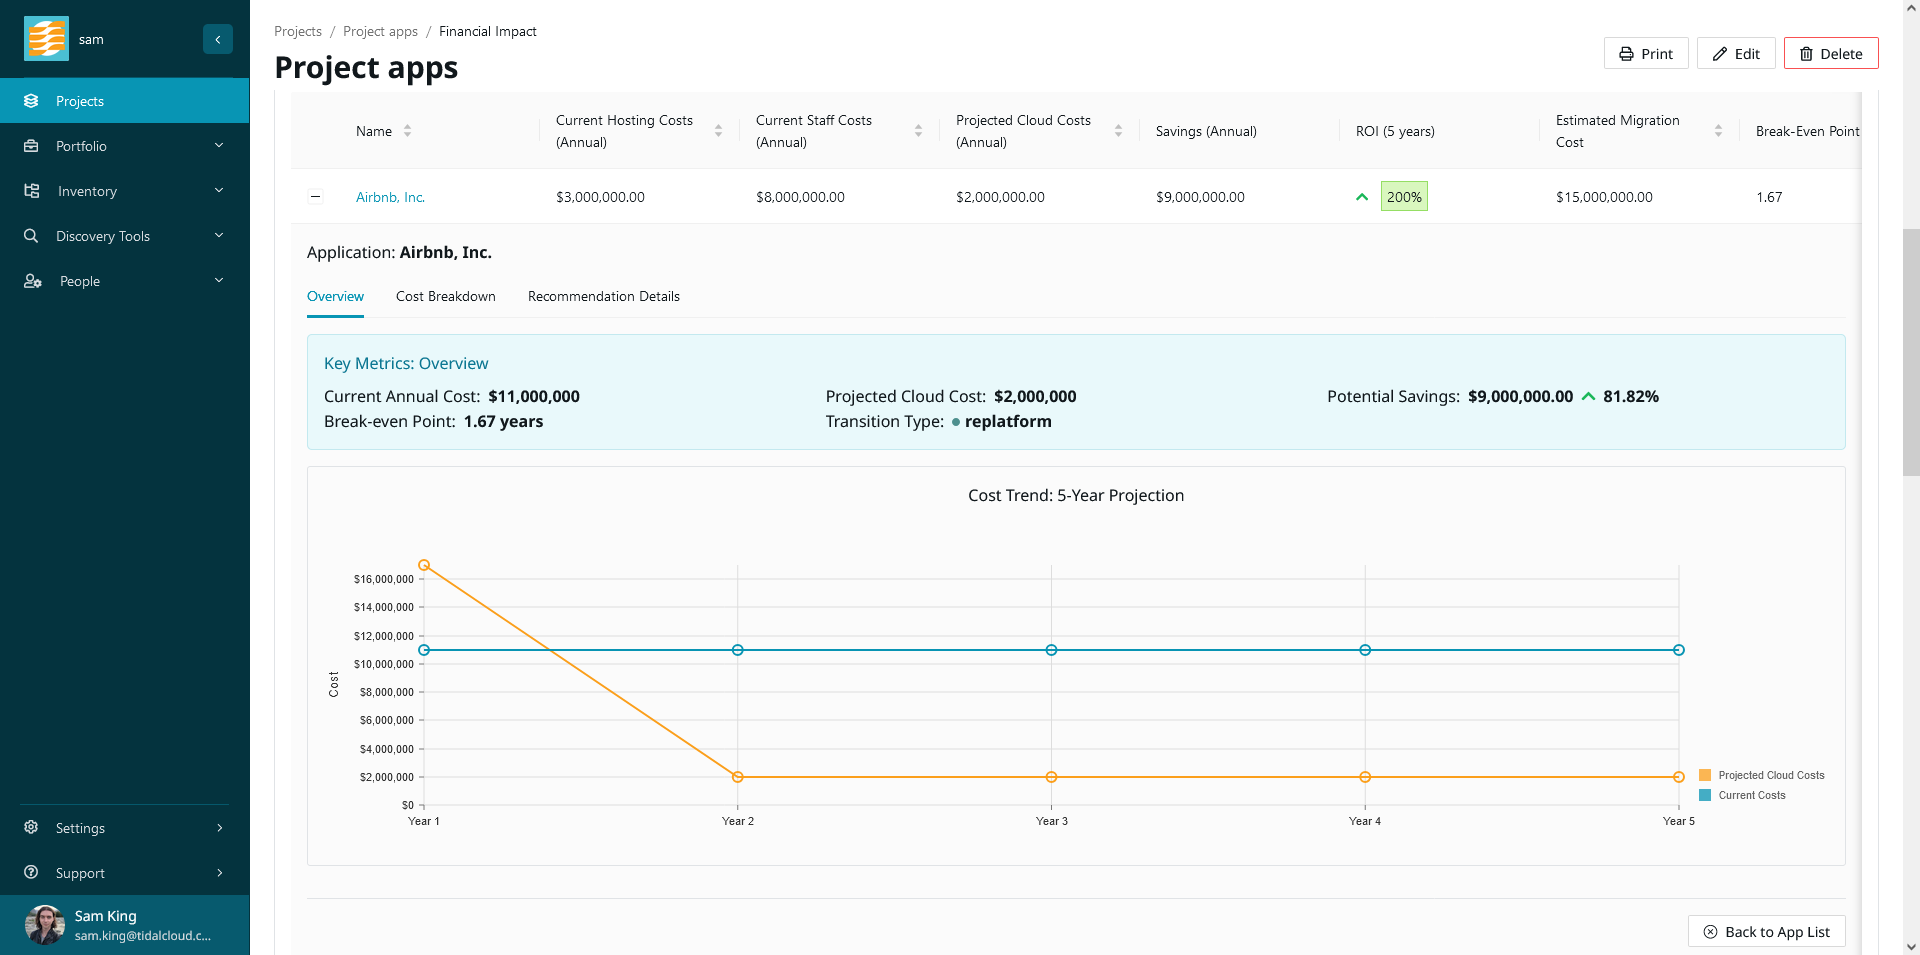
In addition, you can view an application’s financial impact (the drill-down section) in the financial impact tab for an application.
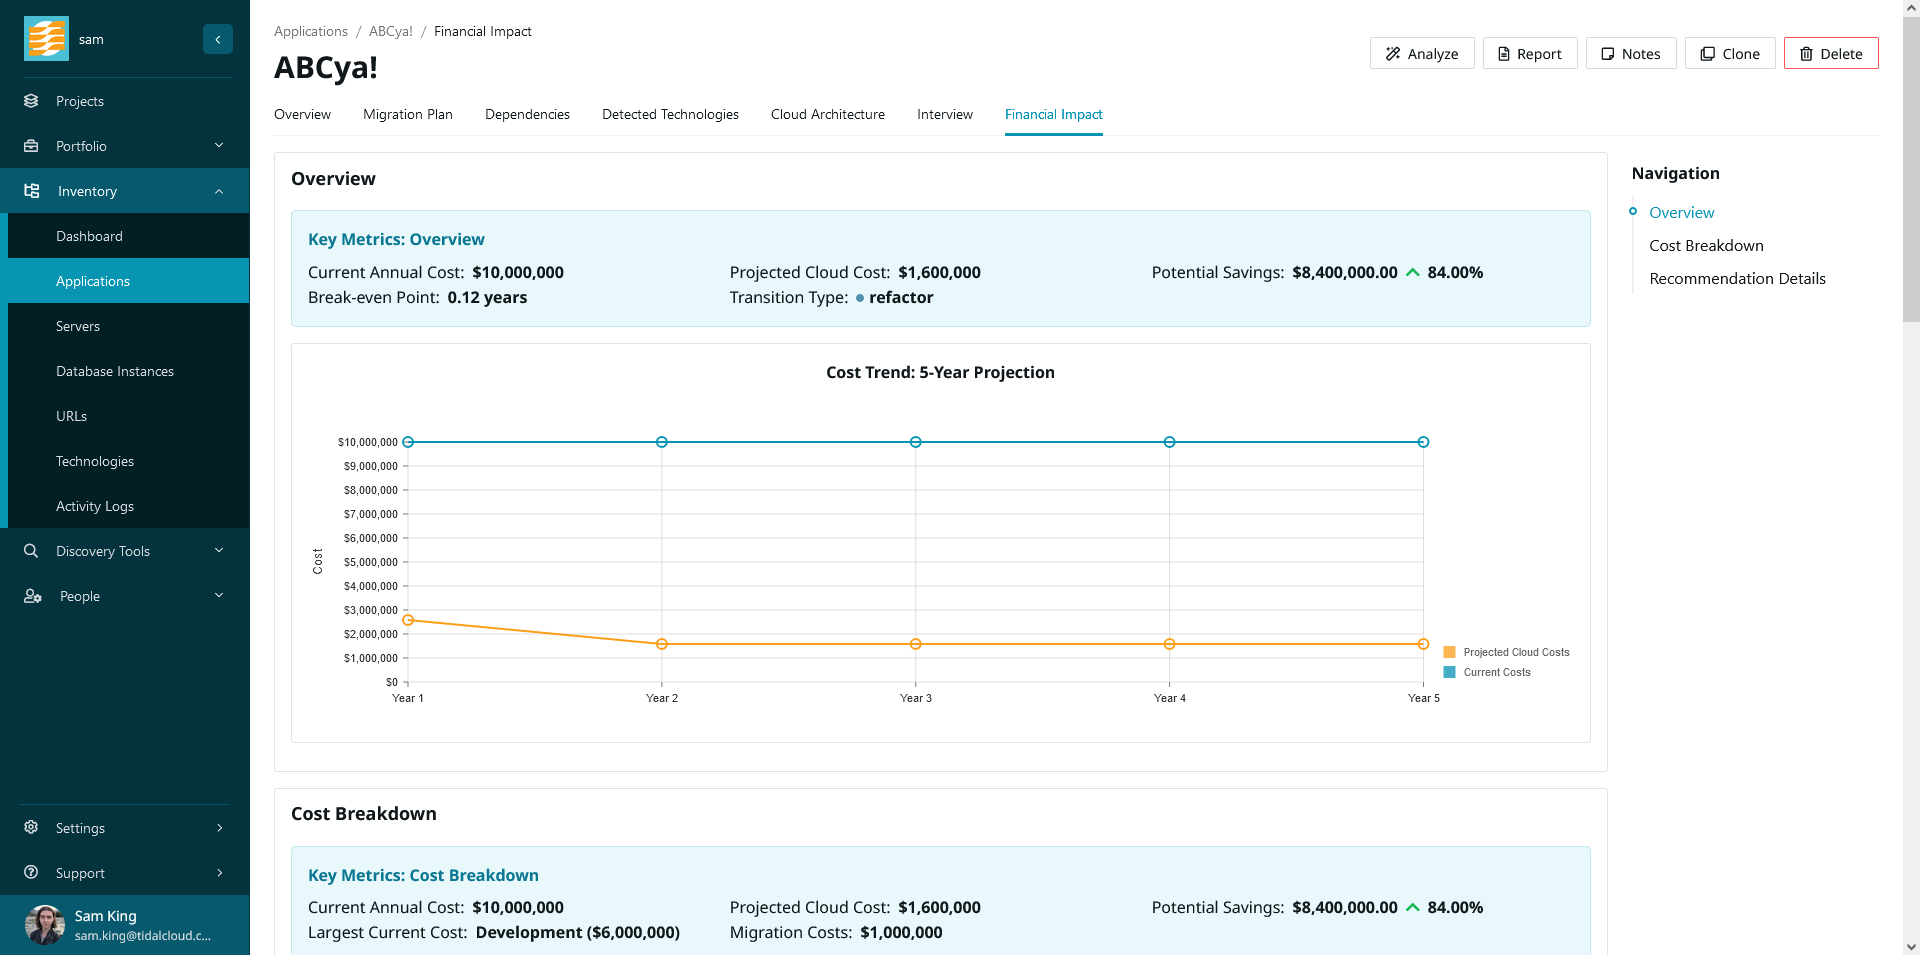
We derive the data for your financial impact report based on information gathered from the application itself, and from your application’s servers via cloud instance targets. For more information about cloud instance targets, you can learn more here.
For all apps, we also include the estimated migration cost in the projected cloud cost for the first year. You can see this visualized in time-series graphs such as’ Current Vs Cloud Costs’ and ‘Savings Over Time’.
Current and Cloud Costs
Arguably the most important data you’ll be dealing with is the current cost and cloud cost for your apps. For the most part, ‘cloud costs’ refers to rehost costs, however we do allow you to visualize and compare ROIs for alternative cloud migration transition types. More on that later.
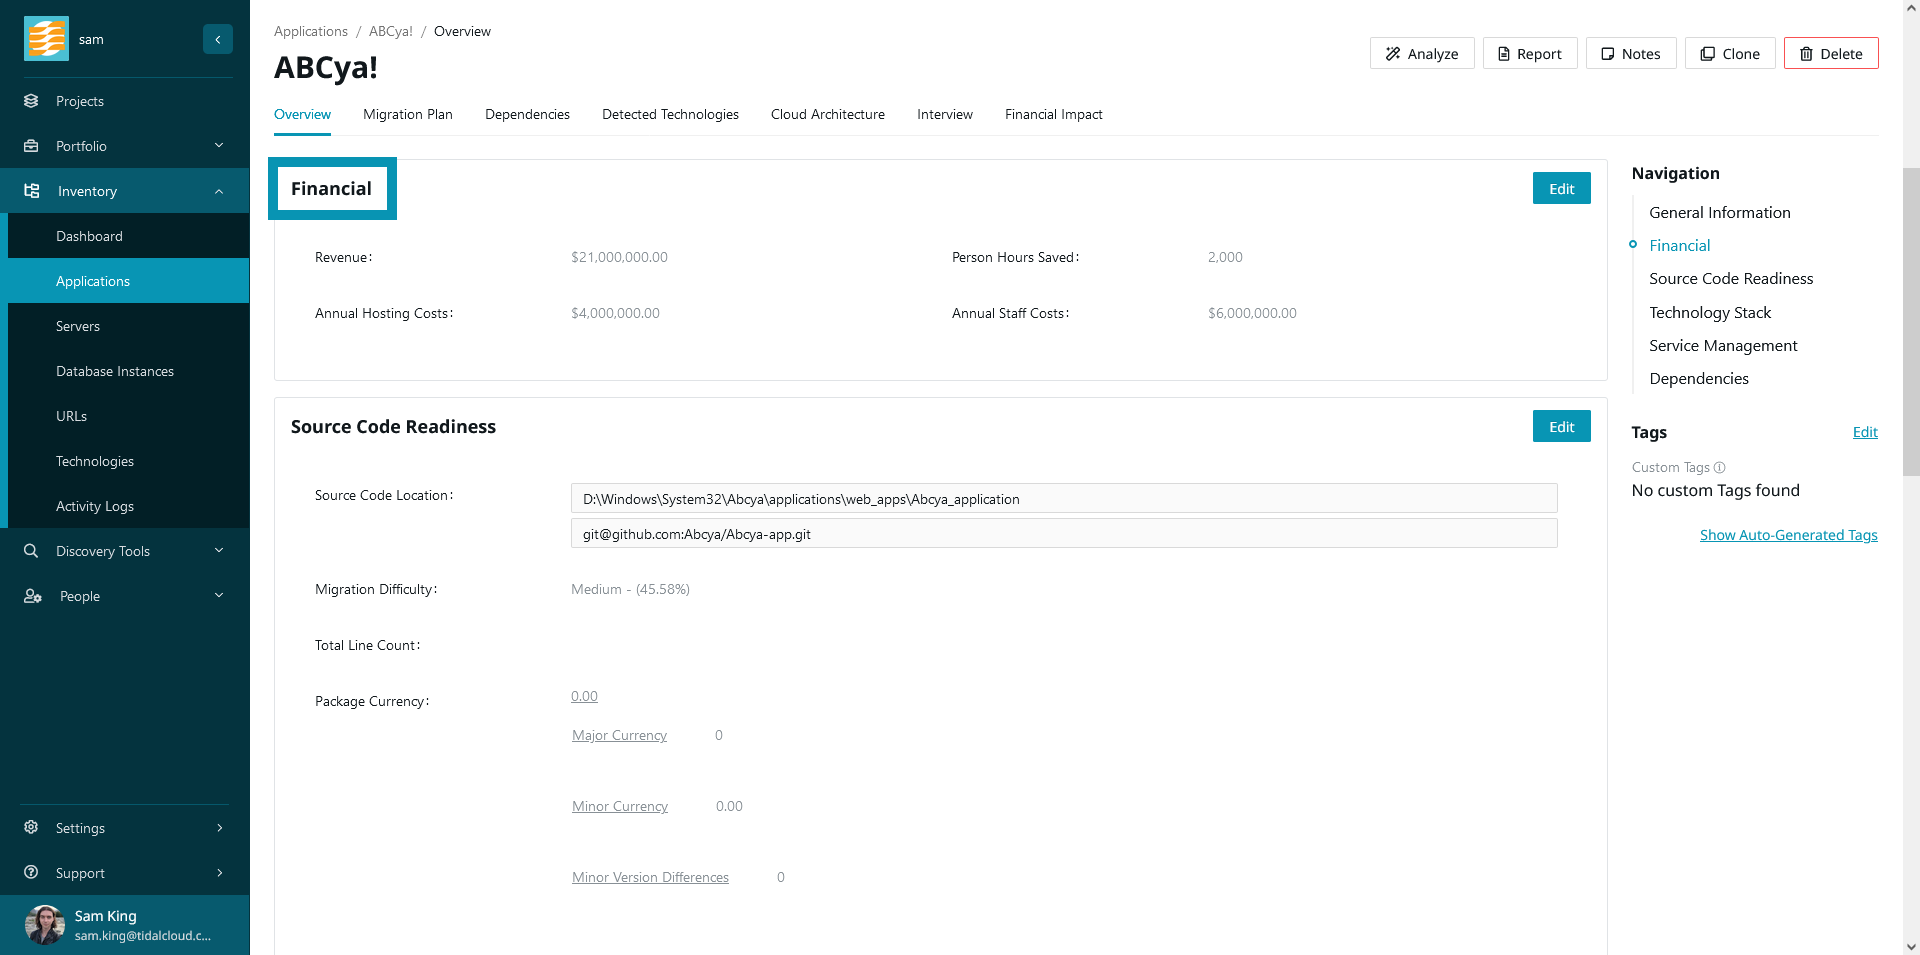
Current costs can be found in the ‘Financial’ category of the application overview. All currency fields which are in this category are counted towards the total annual current cost for this app.
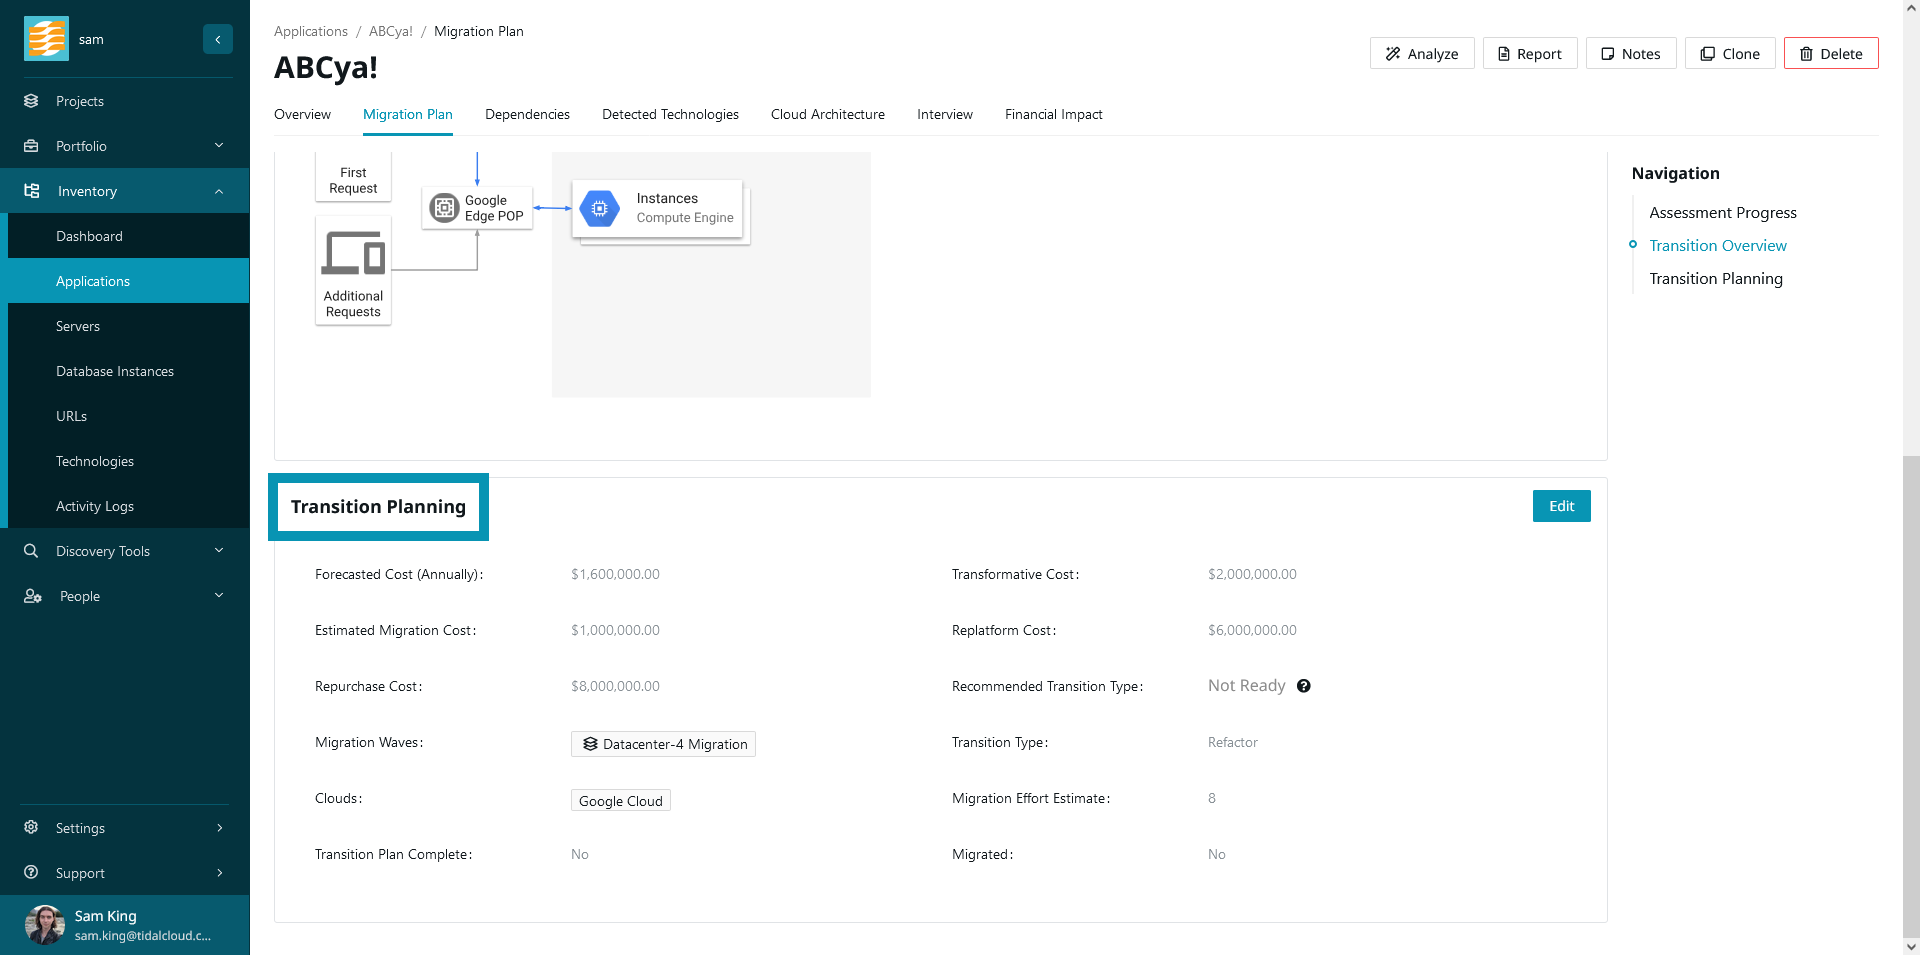
Cloud costs are found in the ‘Cloud Financial Estimates’ category, which is under the ‘Migration Plan’ tab. The fields of note here are ‘Forecasted Cost (Annually)’ which is your estimated rehost cost, and ‘Estimated Migration Cost’, which is used as you might imagine. Note that this migration cost is critical for calculations such as return on investment (ROI) and break-even point, and as noted earlier, this is included in your application’s first year of cloud costs when visualized in time-series graphs.
Financial Classification
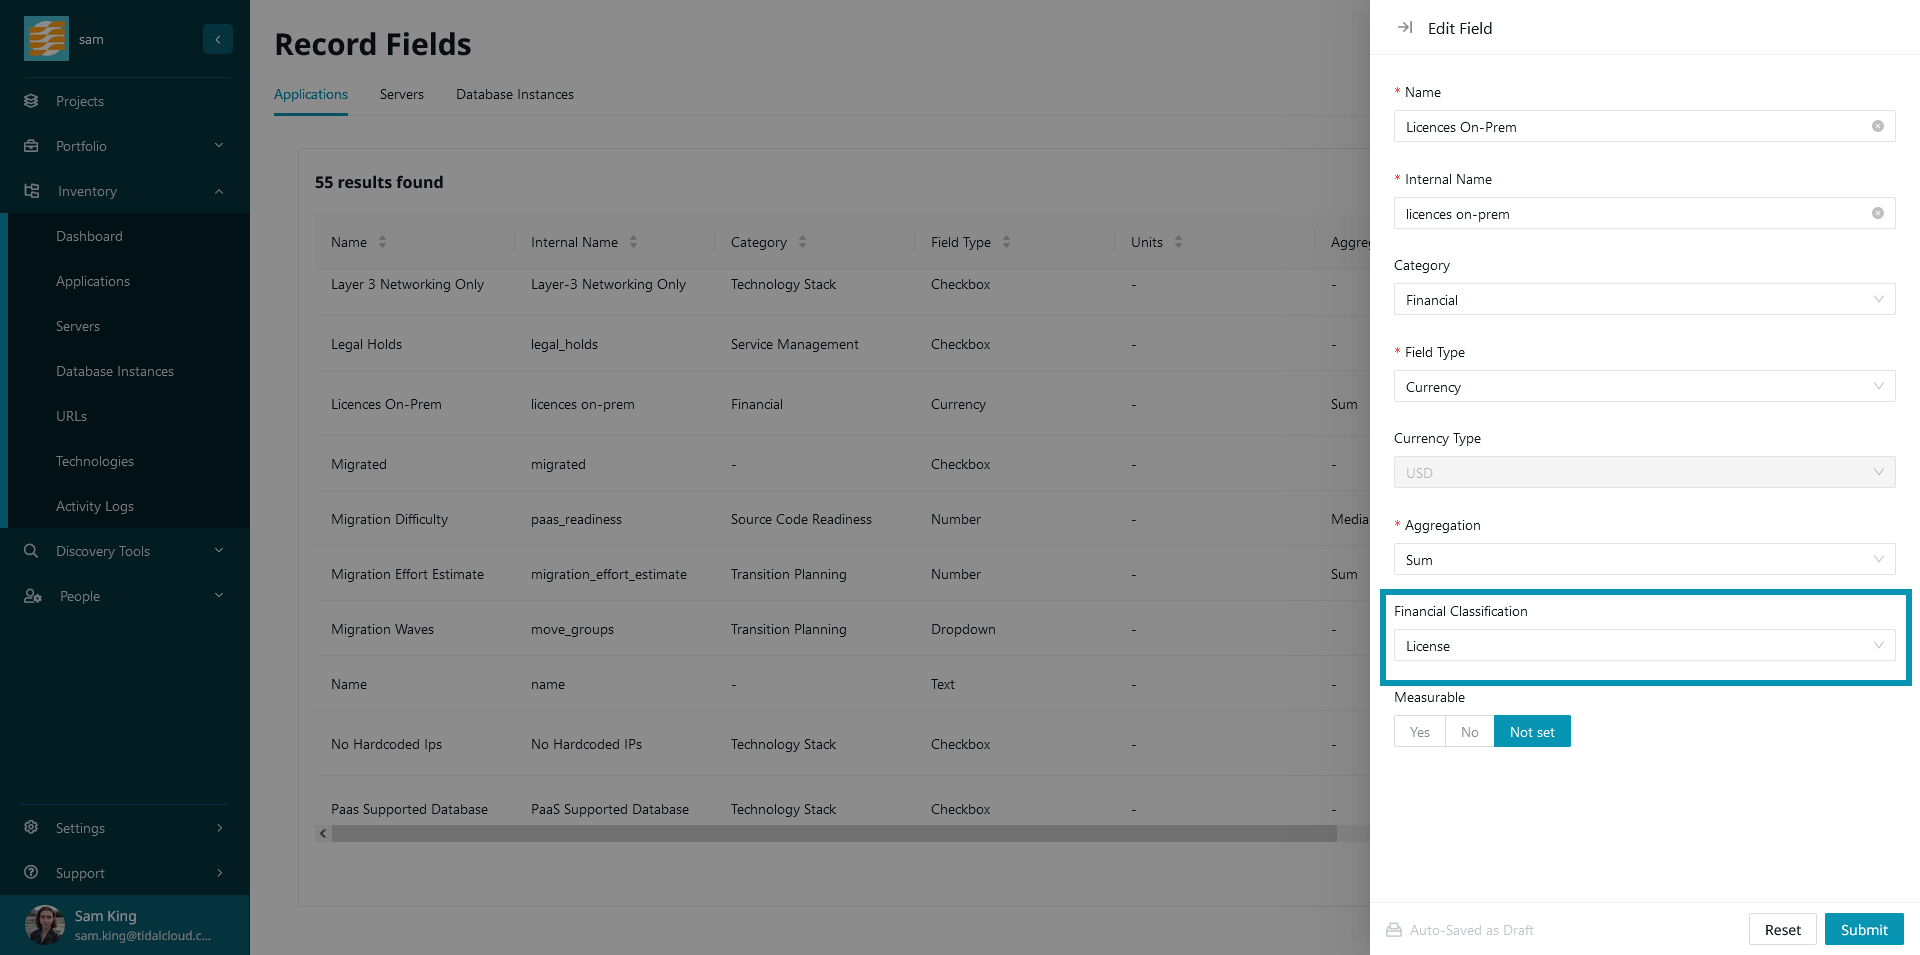
When creating a custom field where the category is ‘Financial’ or ‘Cloud Financial Estimates’ and the field type is ‘Currency’, you’ll notice that there is an additional attribute available - ‘Financial Classification’. This allows you to distinguish between different cost types, such as license or maintenance costs.
These are the available financial classifications:
- License
- Pre- and post-migration software fees
- e.g. Oracle DB
- Subscription
- Costs related to service subscriptions
- e.g. $500 p.a. for Auth0, $3,000 for CloudFlare CDN
- Maintenance and Support
- Staff and operational costs
- e.g. $60k p.a. in FTE costs
- Development
- Ongoing development expenses and investments
- e.g. $375k p.a. in outsourced development fees
- Server
- Expenses related to your physical server infrastructure
- e.g. $89k in server amortization, network, power/cooling, floorspace etc.
- Storage
- Expenses related to your physical storage infrastructure
- e.g. SSD / HDD costs, power, etc.
This system allow you to group costs in the cost breakdown table, as described here.
Customizing the Calculation
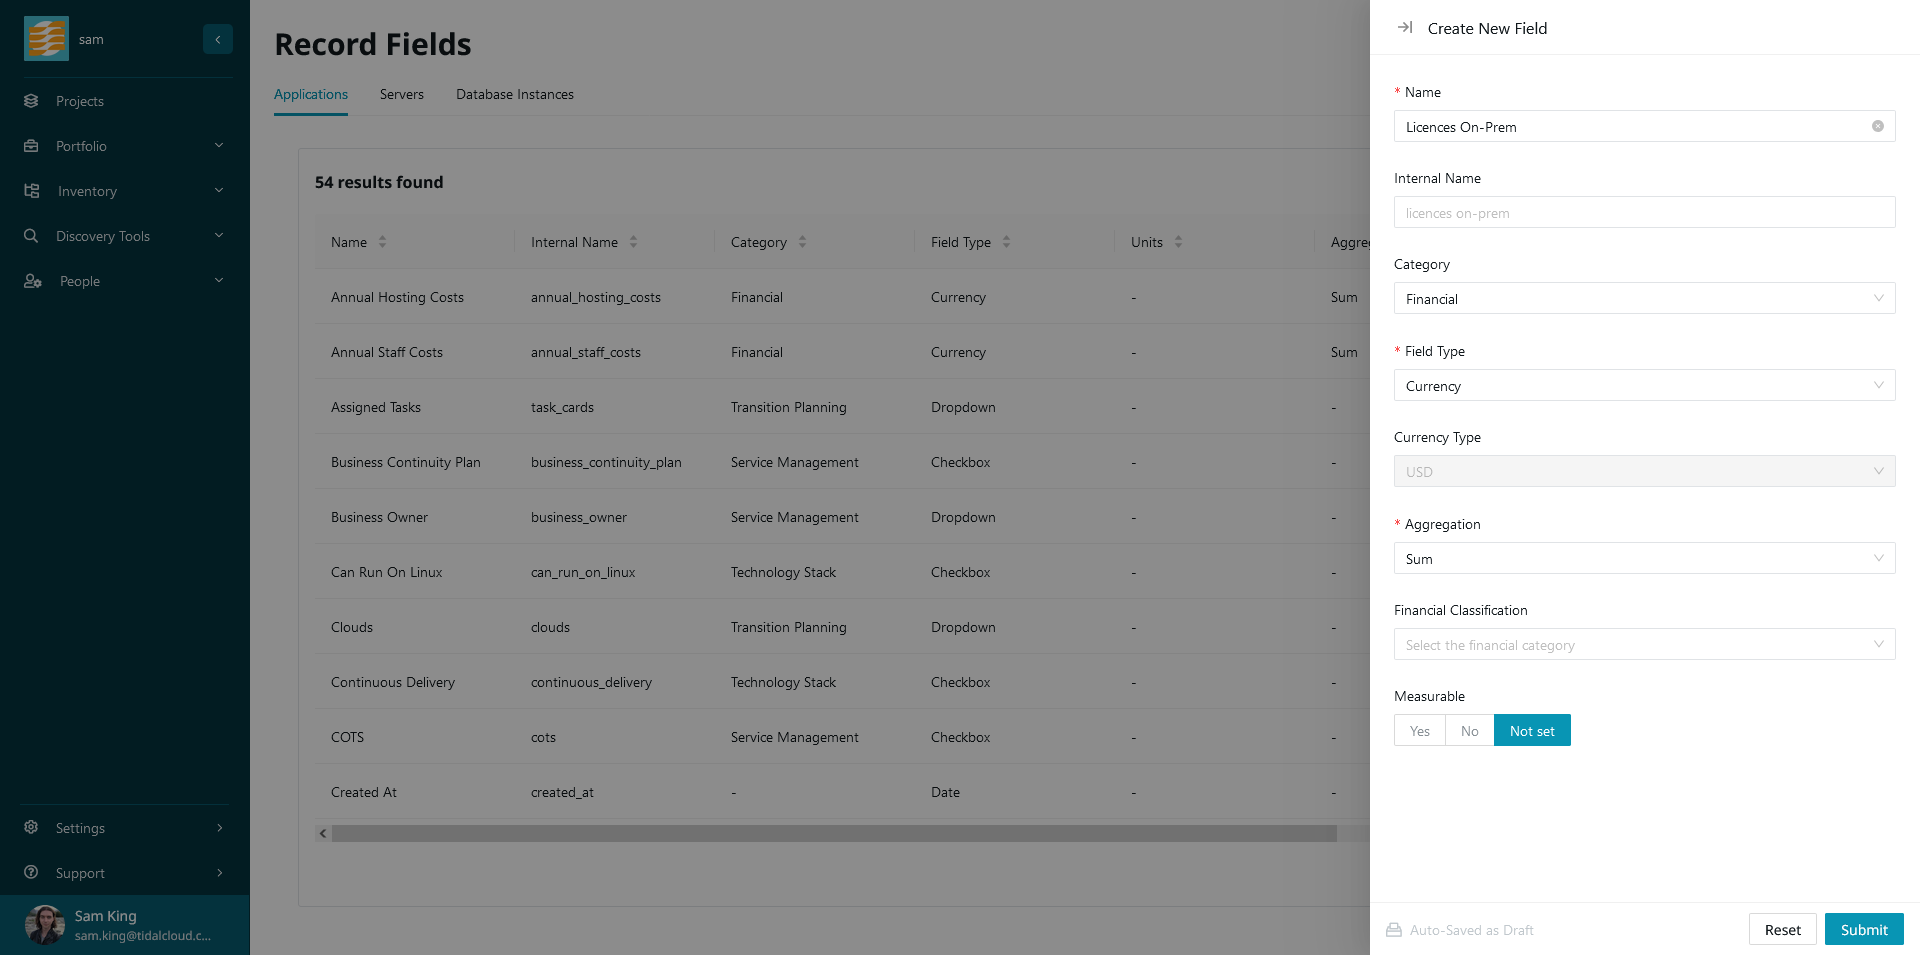
Do you have a cost which is not covered by existing fields? Maybe you pay a license cost for this app, for example. That’s easy to add, simply navigate to settings -> fields and create a new custom field by clicking the ‘+ New’ button. The category you choose for this field determines whether it is a current or a cloud cost. For a current cost, select the ‘Financial’ category, and for a cloud cost, select the ‘Cloud Financial Estimates’ category. You can also set a financial classification at this point as described here. The appropriate classification in this example would be ‘License’.
After you’ve created your custom field, you can navigate back to the application record and populate it with data. Your financial impact visuals will be updated appropriately to reflect this new current or cloud cost.
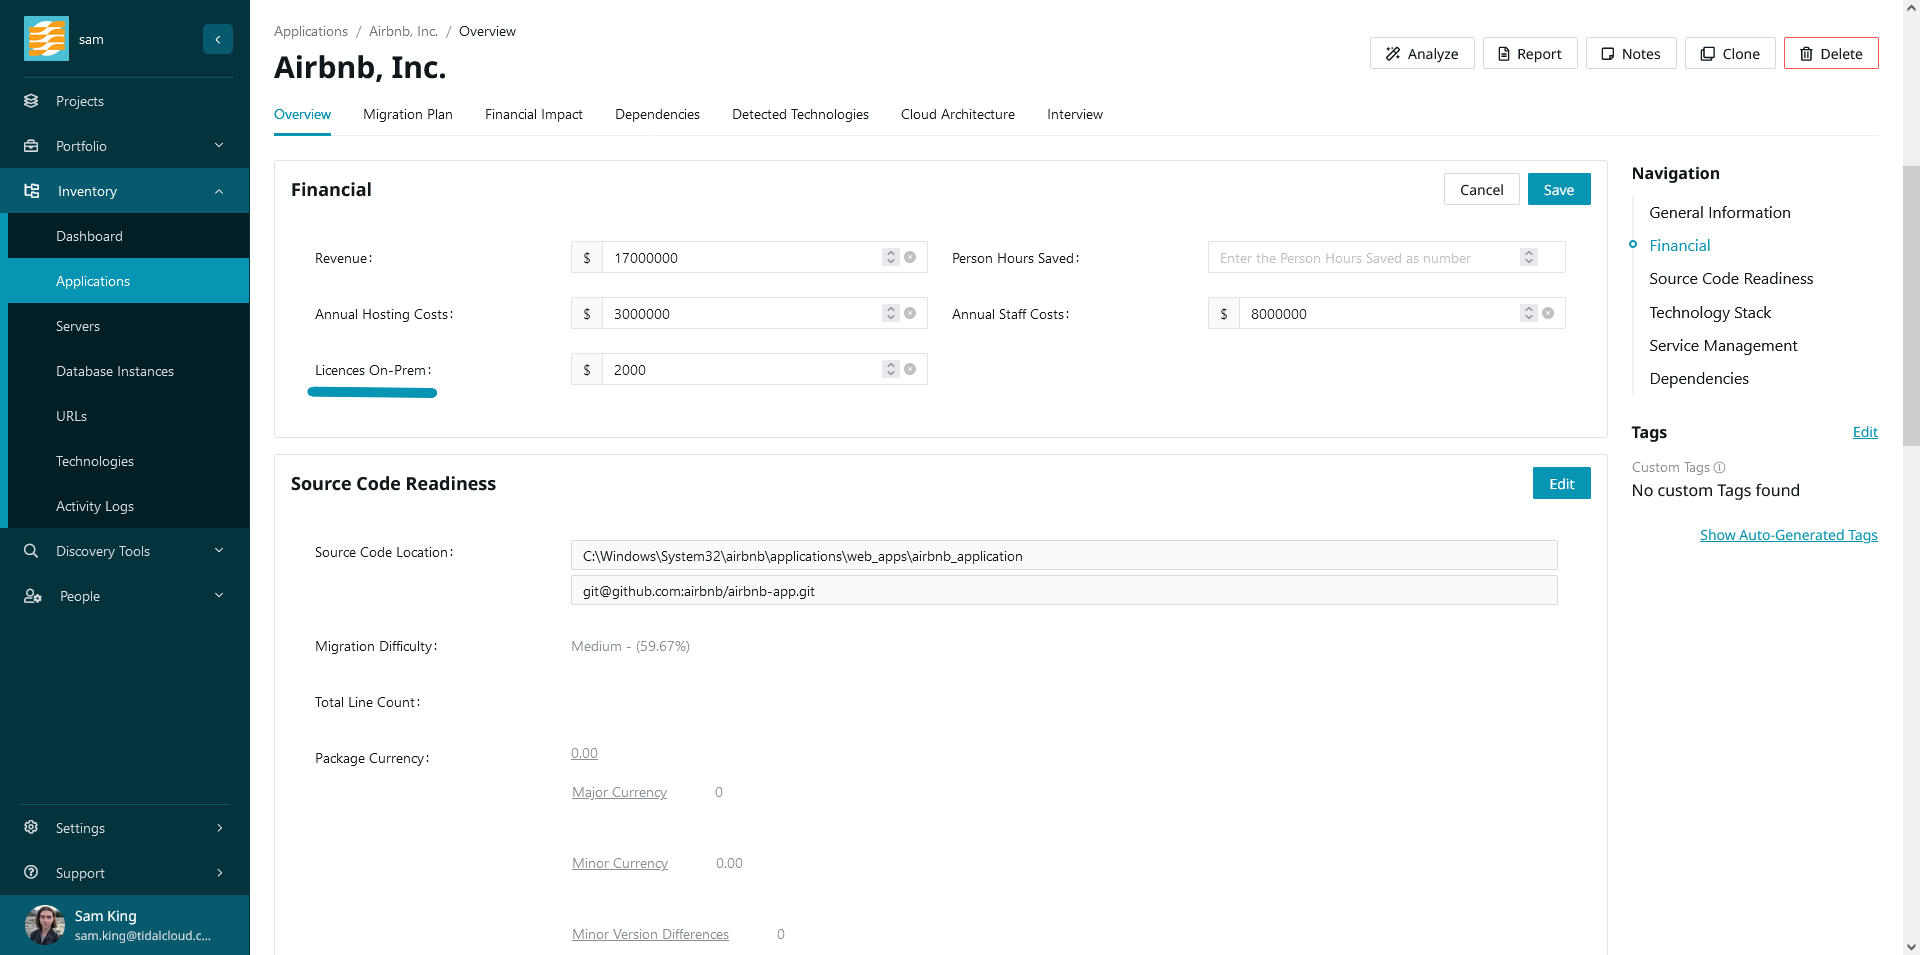
To be included in an application’s current or cloud costs, the field must have category ‘Financial’ or ‘Cloud Financial Estimates’ (for current and cloud costs respectively), and must have the field type ‘Currency’. In most cases, you’ll also want to set the field aggregation to ‘Sum’.
Customizing the Application Cost Breakdown
Building on what you’ve learned so far, you can leverage our financial classification system for further granularity over your application’s current and cloud costs.
On the cost breakdown table, which can be found in the application drill-down (or on the application itself) under ‘Cost Breakdown’, you can see your applications’s costs grouped by financial classification.
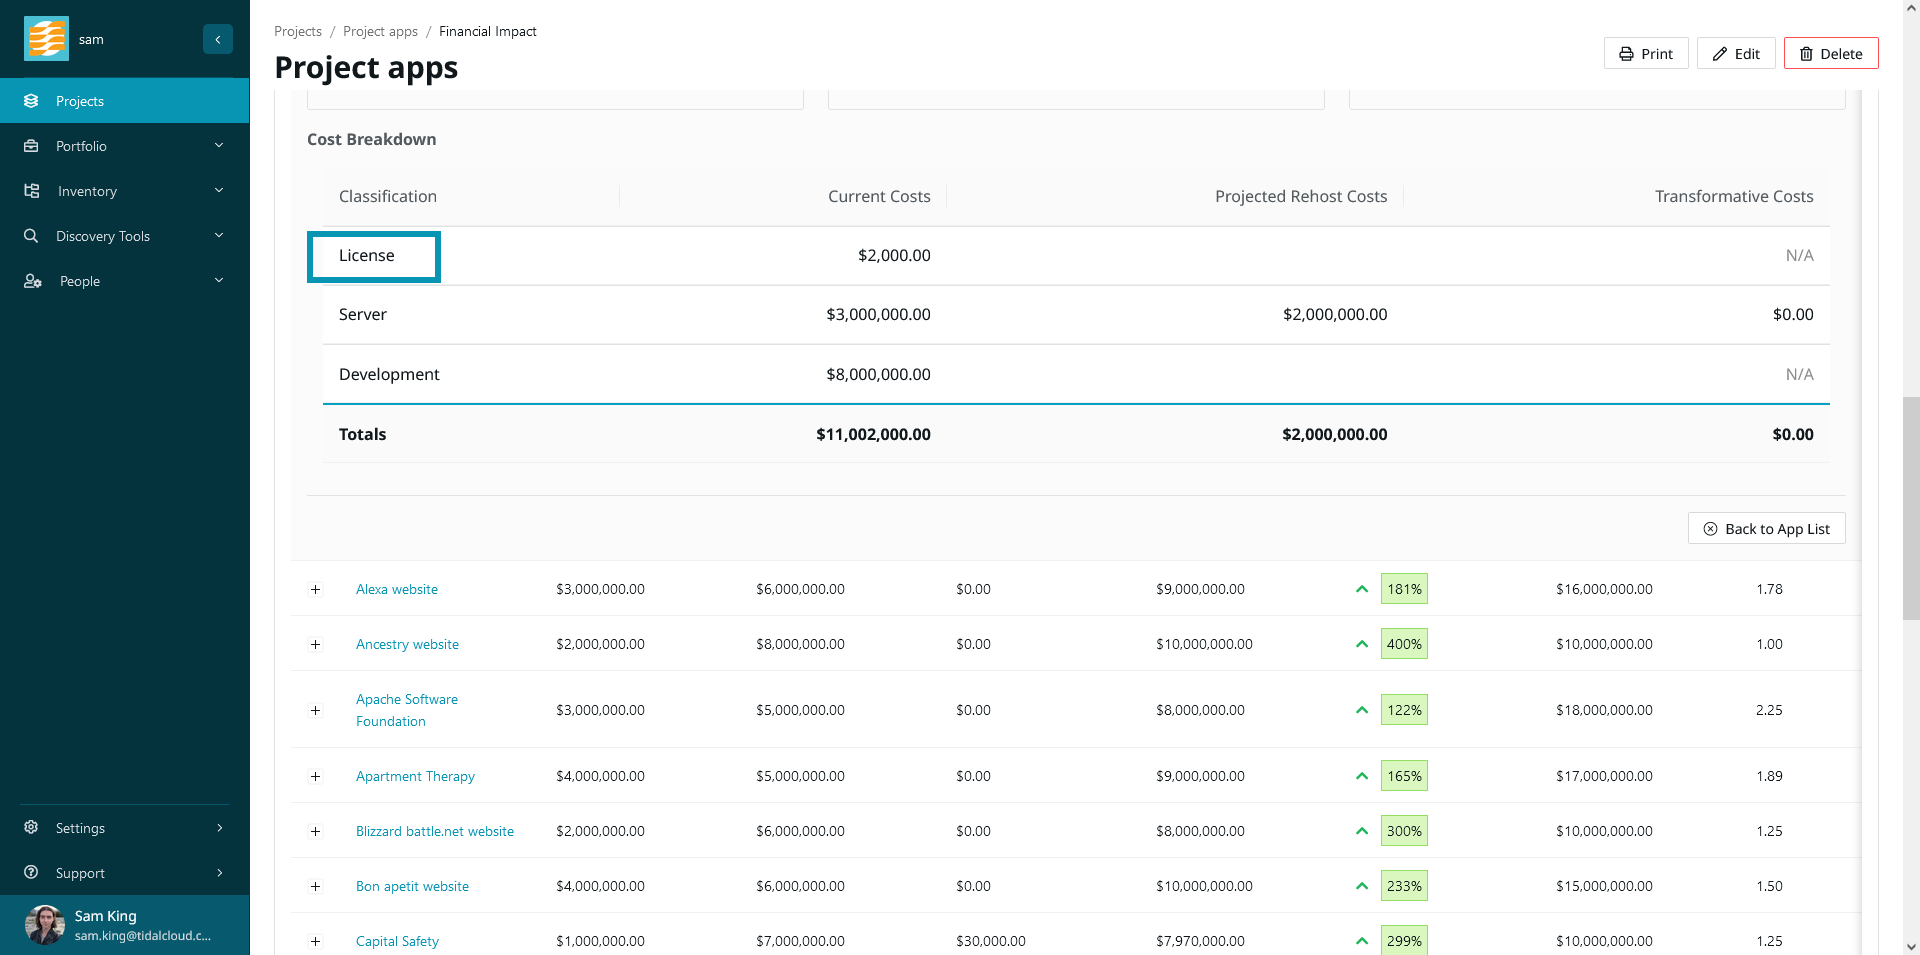
This dovetails with the custom field system outlined above. If you need to add a cost which is not covered by our default fields, then your custom costs will appear on the application record, in our charts and summaries, and here in the cost breakdown table.
Detailed Cost Breakdown
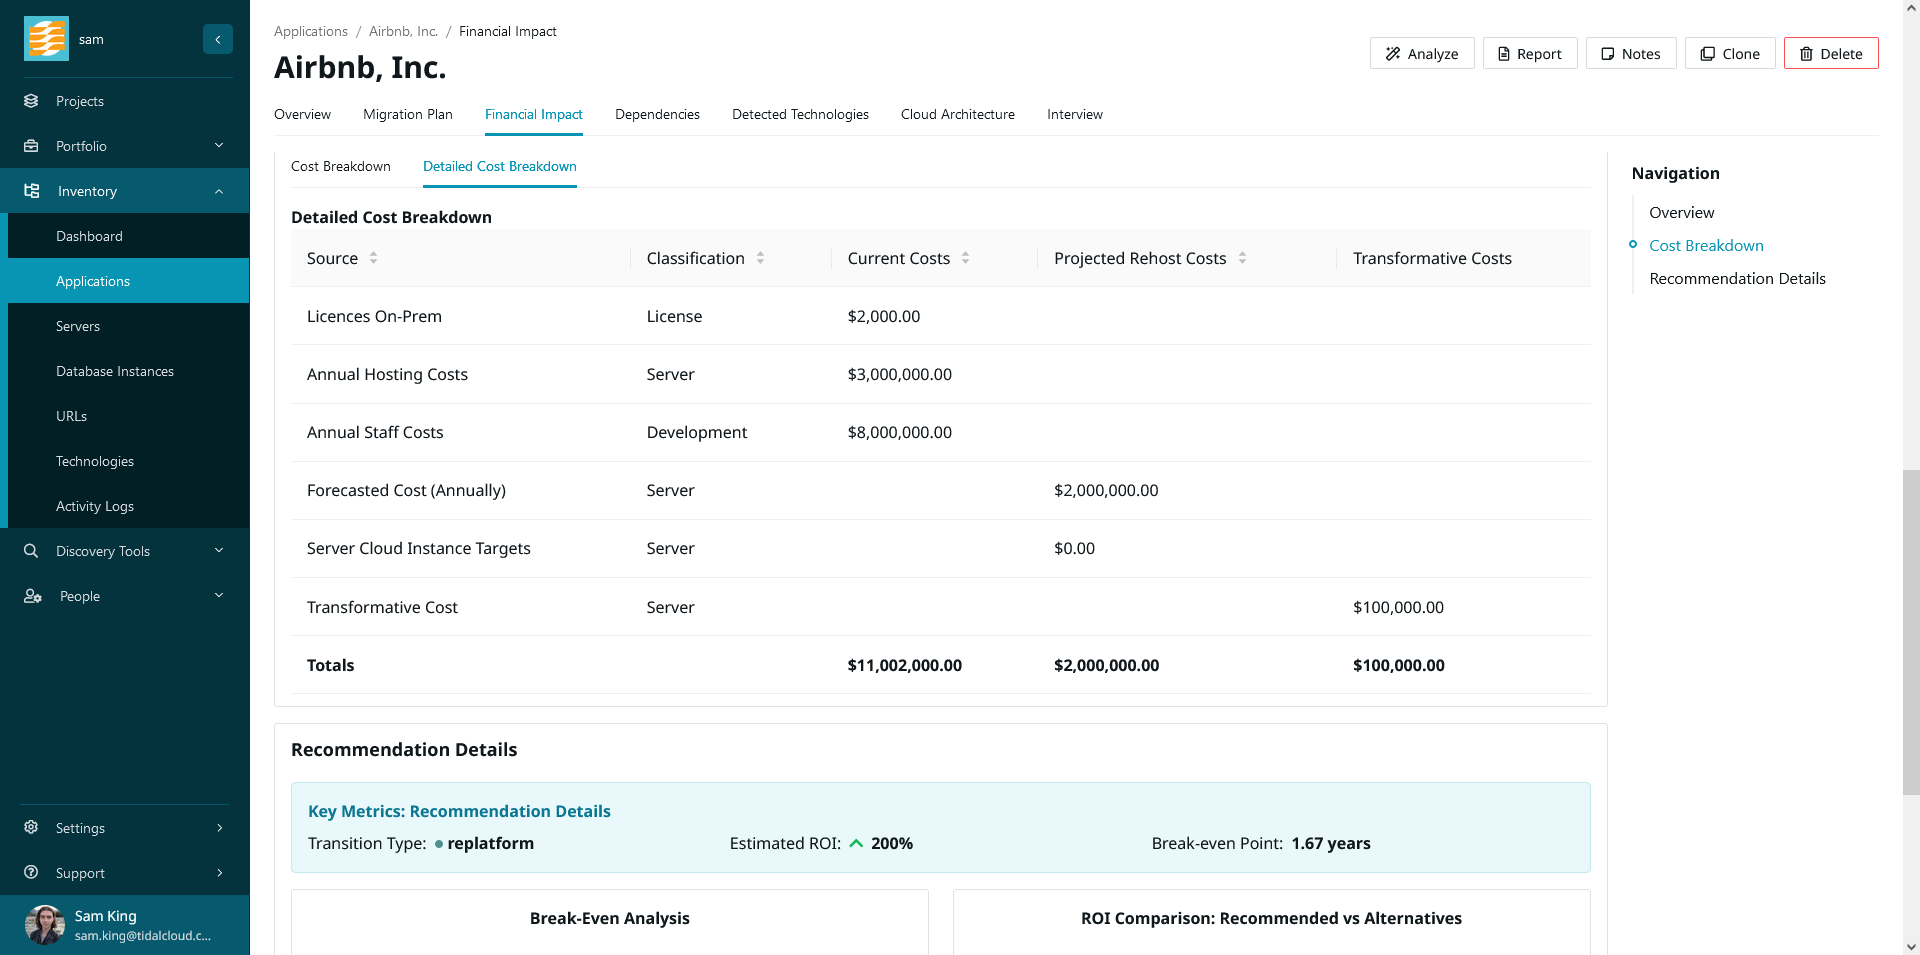
The application record’s financial impact view also has a ‘Detailed Cost Breakdown’ table, which lays out all cost sources for your app, including fields and cloud instance targets. This can be found by navigating to the application record, then the ‘Financial Impact’ tab, under the ‘Cost Breakdown’ section. You will be able to tab between the cost breakdown as described above, and also the detailed cost breakdown, which provides more granularity and insight into an application’s cost sources.
ROI Comparison
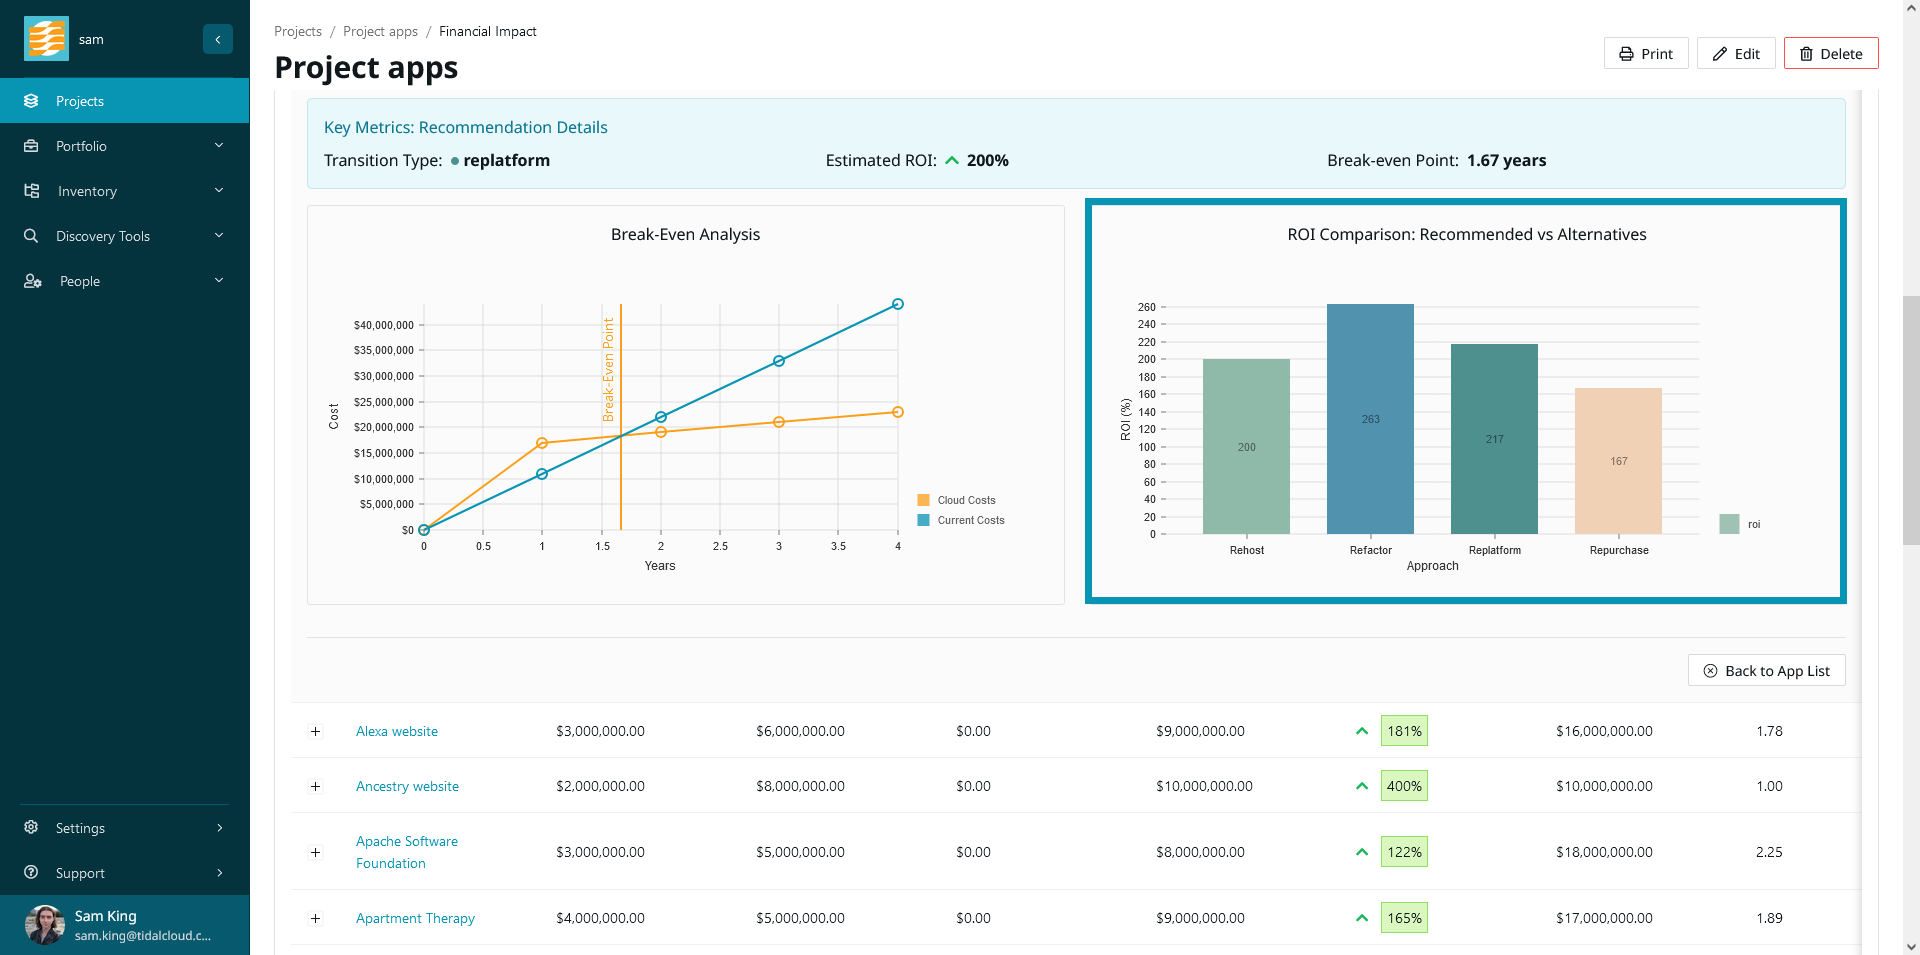
Part of building your cloud migration business case is comparing and contrasting different 6R approaches to cloud migration. Tidal Accelerator’s financial impact report includes a visual comparing the ROI of different possible migration strategies (also known as transition types). This can be found in the application drill-down under ‘Recommendation Details’. To populate this, on the application record under ‘Alternative Transition Estimates’ you will find the following possible fields; ‘Repurchase Cost’, ‘Replatform Cost’, ‘Rehost Cost’, and ‘Transformative Cost’.
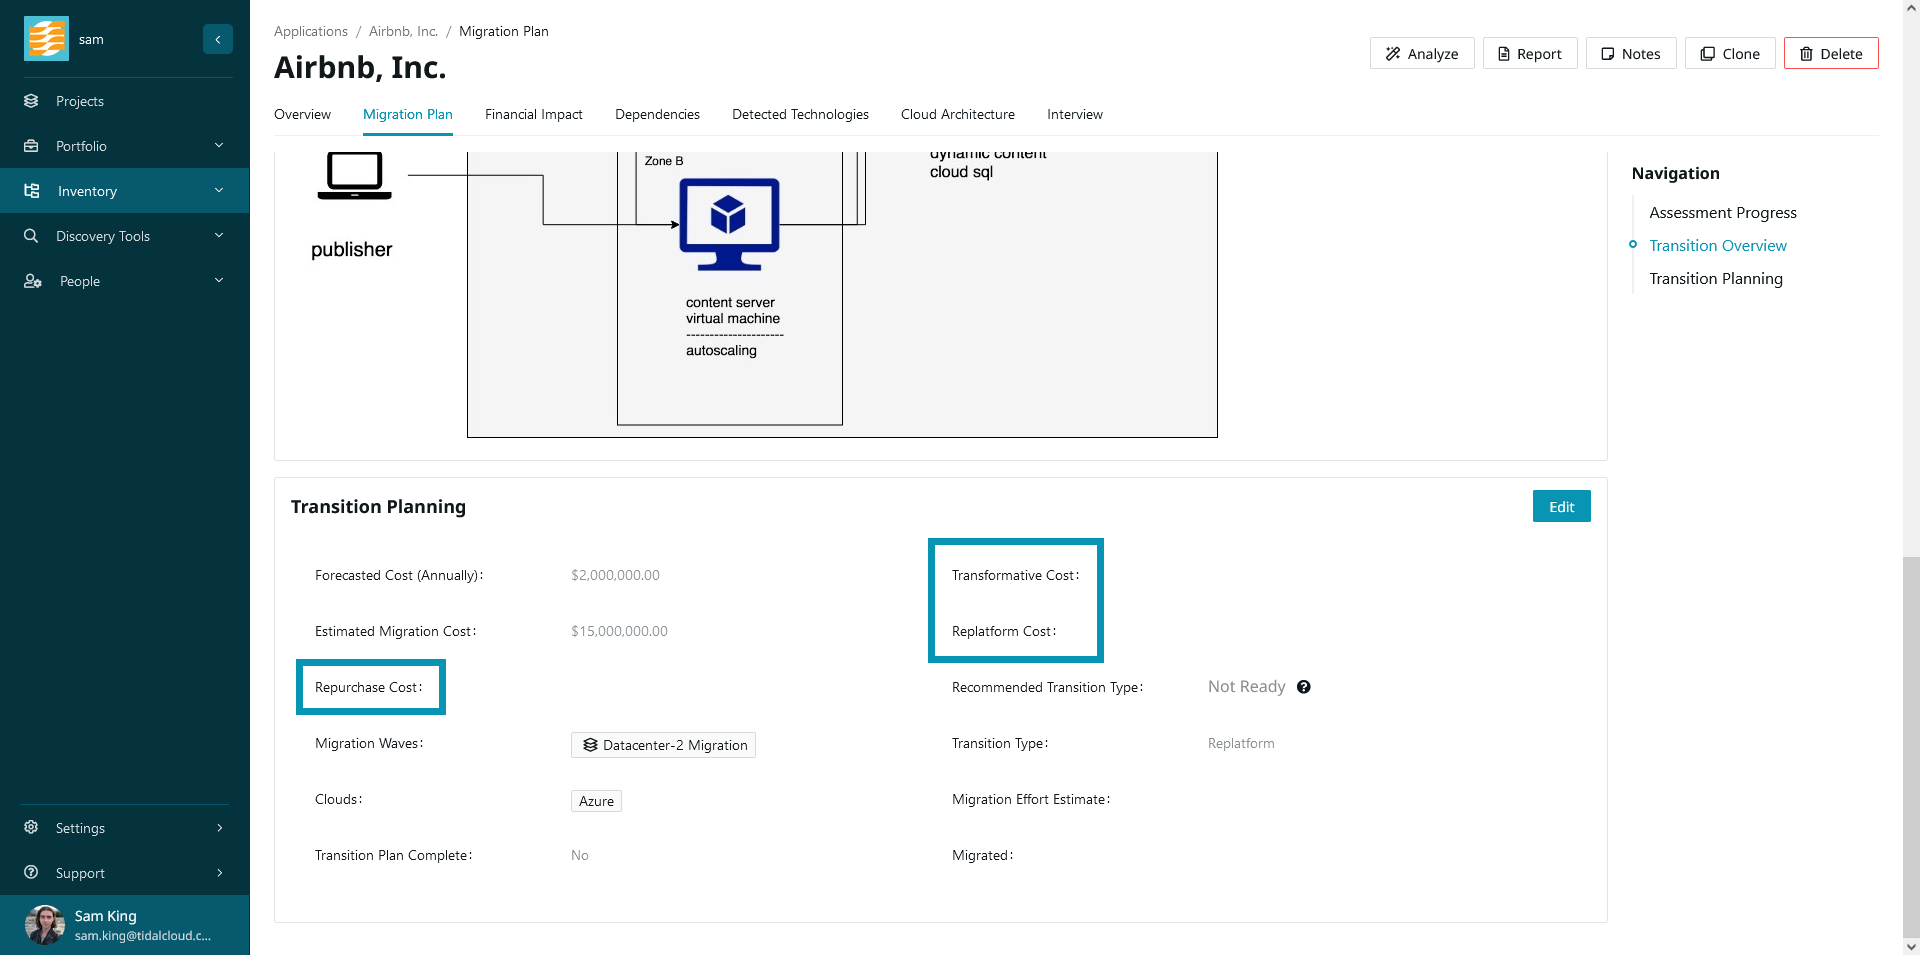
After entering your expected annual cost for each transition type, the ROI comparison chart will be populated with the expected ROI of these approaches.
Printing your Report
To print the financial impact report for your project, simply click the ‘Print’ button shown below and we will generate a printable report for you. This can be used for deliverables or shared with stakeholders to reinforce your cloud migration business case.
