Modernization Assessment
Introduction
Tidal’s AWS Modernization Assessment (AMA) program provides organizations with a no-cost assessment capability for rapidly identifying suitable application candidates for the Modernization Viability Assessment as part of the modernization pathway to AWS.
This guide will walk you through the process of conducting a Modernization Assessment and show you how to download your ready-made Modernization Assessment PowerPoint presentation.
Resources
As we step through the process of completing a Modernization Assessment, you can optionally use demo data to familiarize yourself with the features. Download the demo-data zip file and extract it to your location of choice.
If you have a fresh workspace, you can use this demo data to try out the Modernization Assessment features. Then, you can clear all the data from the workspace to create a blank slate for your actual assessment. Note that performing this action will clear all data in the workspace and cannot be undone. Navigate to <your-workspace>.tidal.cloud/preferences and select ‘Remove all data’.
After extracting the demo data, you will find the following contents:
- demo-records - a directory containing three spreadsheets: servers, database instances and applications for your workspace.
- sct-results - a directory containing two AWS Schema Conversion Tool result sets.
Software
Tidal software for your toolkit to support your Modernization Assessment:
- Tidal Tools - Download and install Tidal Tools. For help, see our documentation here.
- Note that Tidal Tools requires Docker to be installed on your machine.
- Machine Stats - (Optional) Scan your servers and output a result which can be uploaded to Accelerator.
- Machine Stats for Unix-like Systems Detailed guides here.
- Machine Stats for Windows Detailed guides here.
Modernization Assessment
Step 1: Import Data from Spreadsheets
First, we will import your servers, database instances and applications from spreadsheets into Tidal Accelerator.
To get started, navigate to the ‘Import Spreadsheets’ page, which you can find in the navigation sidebar under ‘Discovery Tools’.
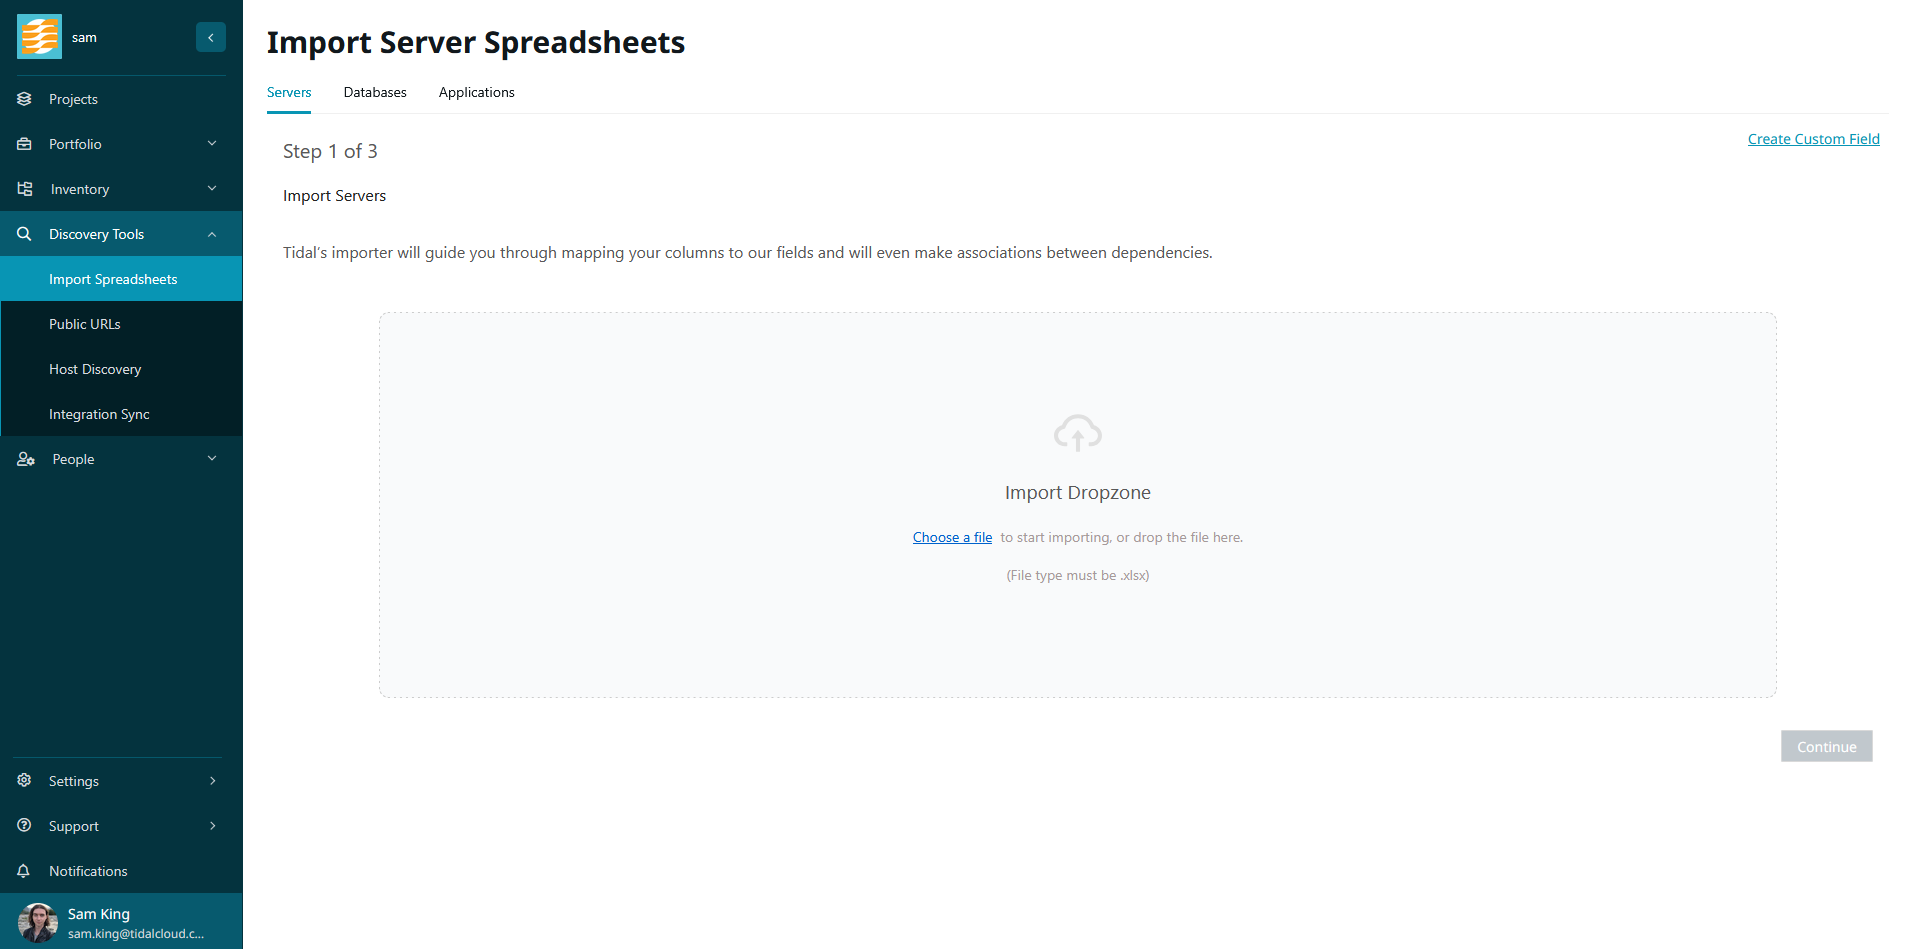
Here you will find a dropzone to import your server records. Tidal Accelerator supports three primary record types: servers, database instances, and applications. You must import these record types separately; for example, you will have one spreadsheet for your servers, one for your database instances, and one for your applications.
Note that the tabs at the top of the page correspond to a record type. You must ensure you are on the correct tab for the record type you are uploading.
By importing these records in the correct order (servers, database instances, applications) and by setting the association fields correctly, Tidal Accelerator will automatically build relationships between these records. You can find more details on the association fields for each record type here.
On the servers tab, upload your spreadsheet of server records. Follow the steps of the wizard to preview and complete your upload. You can then navigate to the ‘Databases’ tab and perform the process again for your database spreadsheet, and after that, you can do the same for your application spreadsheet.
For more details on uploading spreadsheets to Tidal Accelerator, including how to create custom data fields in Accelerator, see our documentation here.
The file type of spreadsheets that you upload to Accelerator must be .xlsx
Step 2: Conduct Application Owner Interviews
Application owner interviews enable you to obtain the most up-to-date information on your applications, directly from the source—the application owner. This is critical to ensuring you have the best possible data and allows you to fill in gaps that might be present in the data imported from spreadsheets.
We’ve put together a brief guide on goals and best practices of application owner interviews, which you can find here.
To conduct an interview, first navigate to your application record by selecting ‘Application’ from the navigation sidebar, under ‘Inventory’. Here you will see a list of your applications, and you can select the application for which you’d like to conduct the interview.
On the application record, navigate to the ‘Interview’ tab.
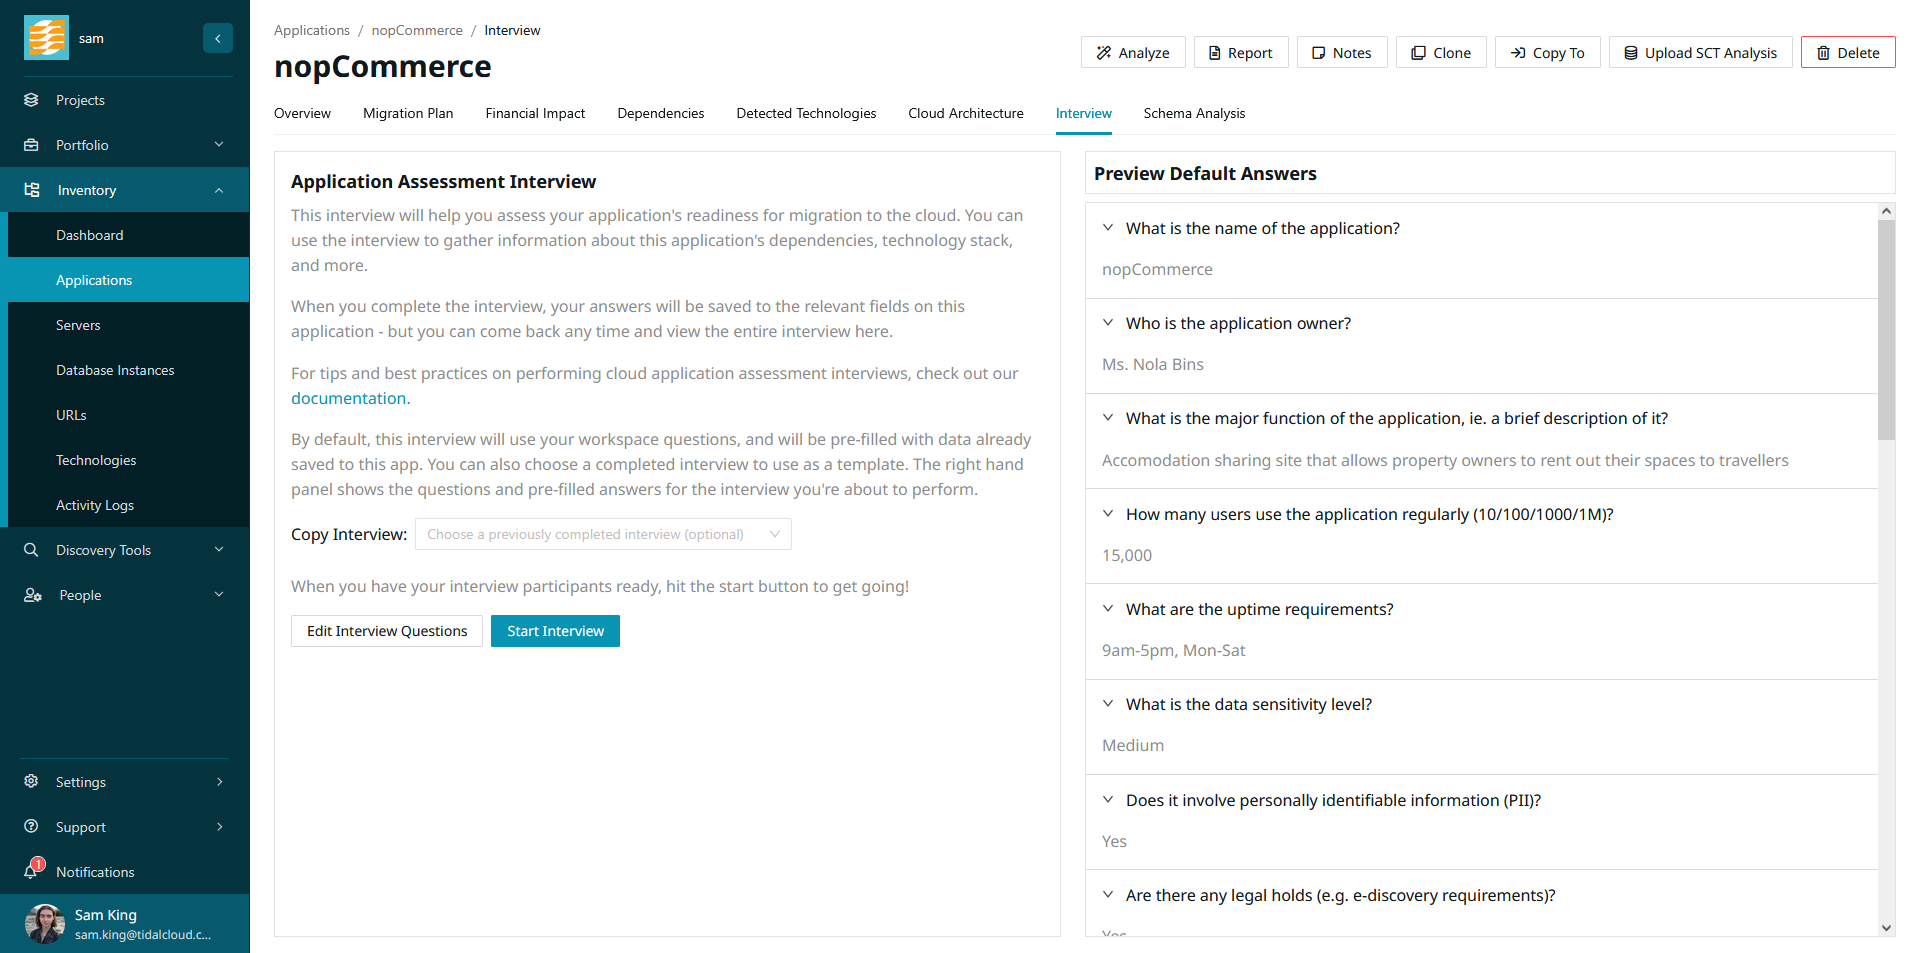
Here you will see a preview of the interview you’re about to conduct. Accelerator includes a series of default questions based on our experience conducting application owner interviews. You can customize these questions by navigating to ‘Interview Questions,’ which is located under ‘Settings’ in the navigation sidebar.
In the preview, you will also see the default answers to these questions. Each question corresponds to a field on the application record, and if data is already present for that field, it will appear as the default answer. This is to avoid you needing to enter data for questions to which you already know the answer.
You can also copy completed interviews from other applications. This is useful when conducting interviews for applications which are very similar. This will override the default answers with those of the interview that you’re copying in.
When you have the application owner present and you’re ready to conduct the interview, click ‘Start Interview’ to get going.
You will be shown a wizard which walks you through the questions in sequence. For each question, you can accept the default answer or enter new data based on the answer you get from the application owner. If there is additional context you’d like to capture, you can include this in the ‘Notes’ section of each question.
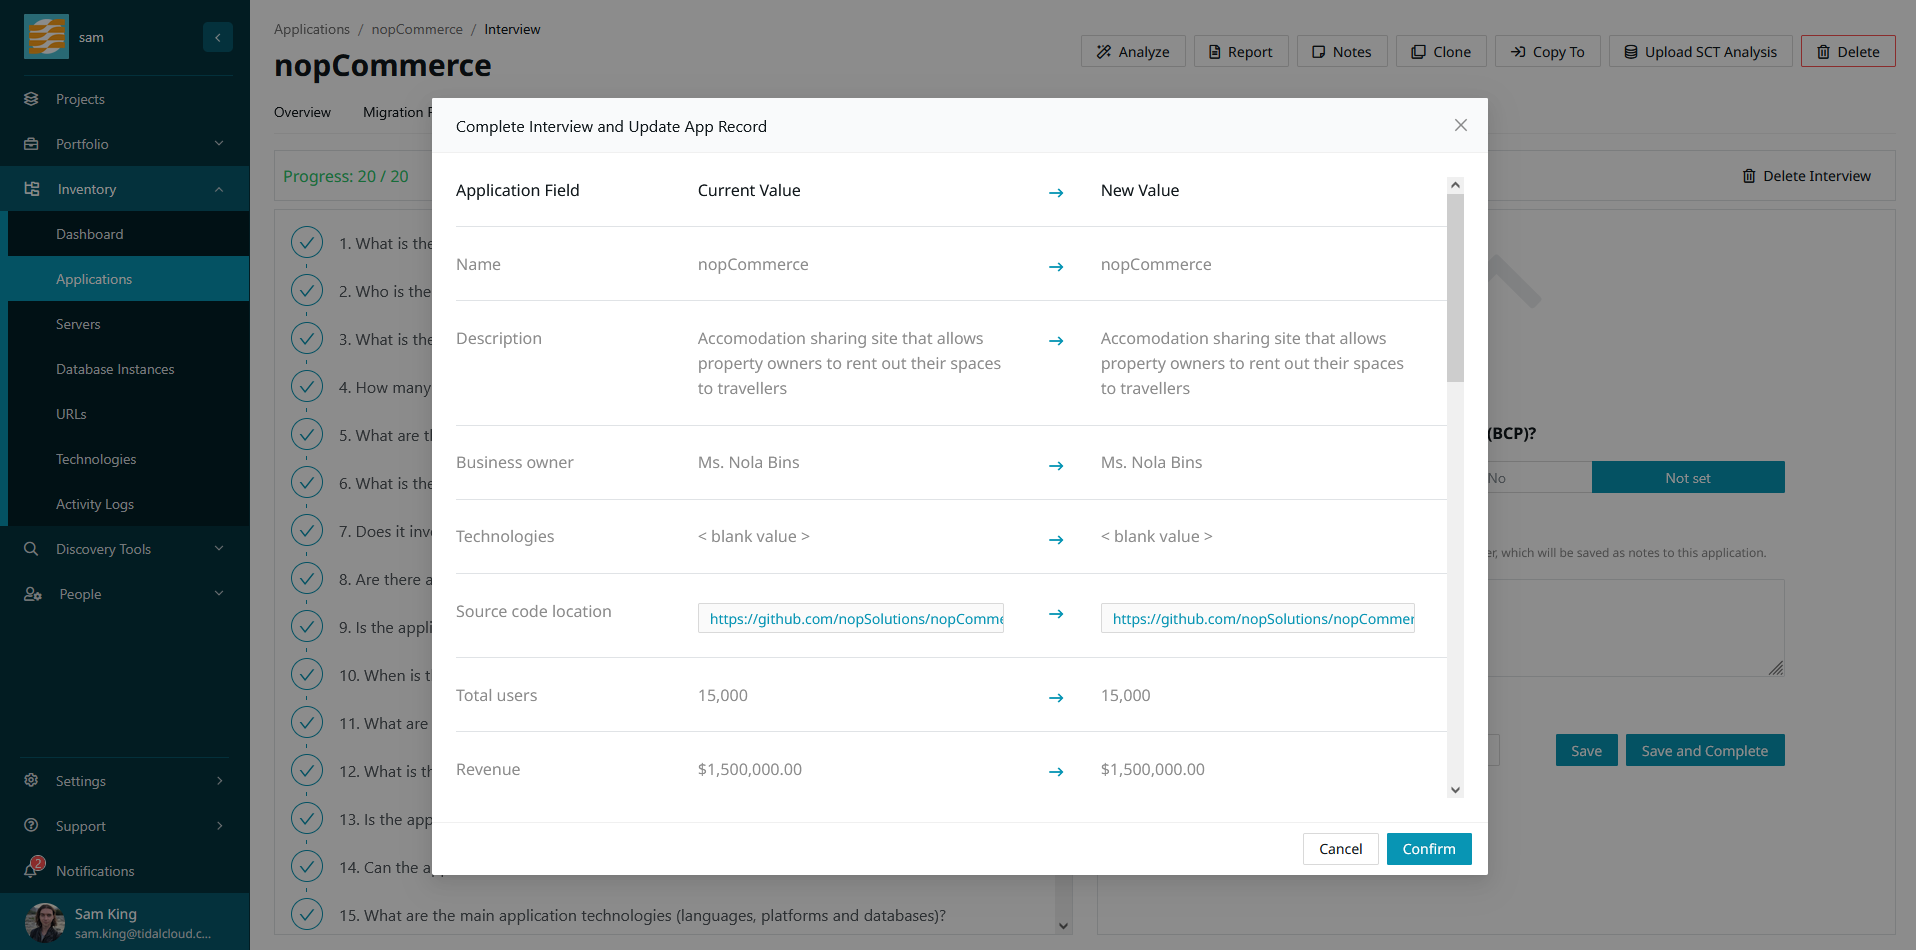
On the final question, you will be prompted to ‘Save and Complete’ the interview. Click this, and you will be shown a confirmation modal that displays the current value of each application field and the new value based on the answer provided during the interview. If you are satisfied, click ‘Confirm’ and this data will be saved to the application record.
While this data has been saved to the relevant fields of the application, this can be overwritten by edits to the application itself. You can review the answers to the interview at any time, and you can delete the interview if you’d like to conduct a new one.
If you have recorded a video of the interview via screen capture, you can upload the recording to the drop zone on the completed interview page. Note that deleting the interview will also delete this recording.
Notes that you capture during the interview can be accessed by clicking the ‘Notes’ button in the toolbar at the top of the application page.
Step 3: Perform Source Code Analysis
You can learn more about the modernization potential of your applications by analyzing their source code. Tidal Code Analysis provides insight into application language composition, as well as the application’s currency, via dependency analysis. This data is also surfaced as visuals on the Portfolio Insights and Project Insights pages.
Tidal Code Analysis is performed using our command-line software utility Tidal Tools. The software is available to download here, and you can learn more about getting started with the tool in our guide here.
Tidal Source Code Analysis uses Docker under the hood. There is a known issue with Docker where scanning a codebase hosted on a Windows file system will be very time consuming. If you are on Windows, we recommend hosting the sourse code which you will analyze on WSL.
Once you have Tidal Tools installed, run the following command and follow the prompts to authenticate with Accelerator.
tidal login
Once you are authenticated, run the following command from the root directory of the application’s source code.
tidal analyze code --app-id <id>
Where <id> is the application’s ID, found in the URL bar on the application page. You can find this command pre-generated for you on the application page in the ‘Source Code Readiness’ section.
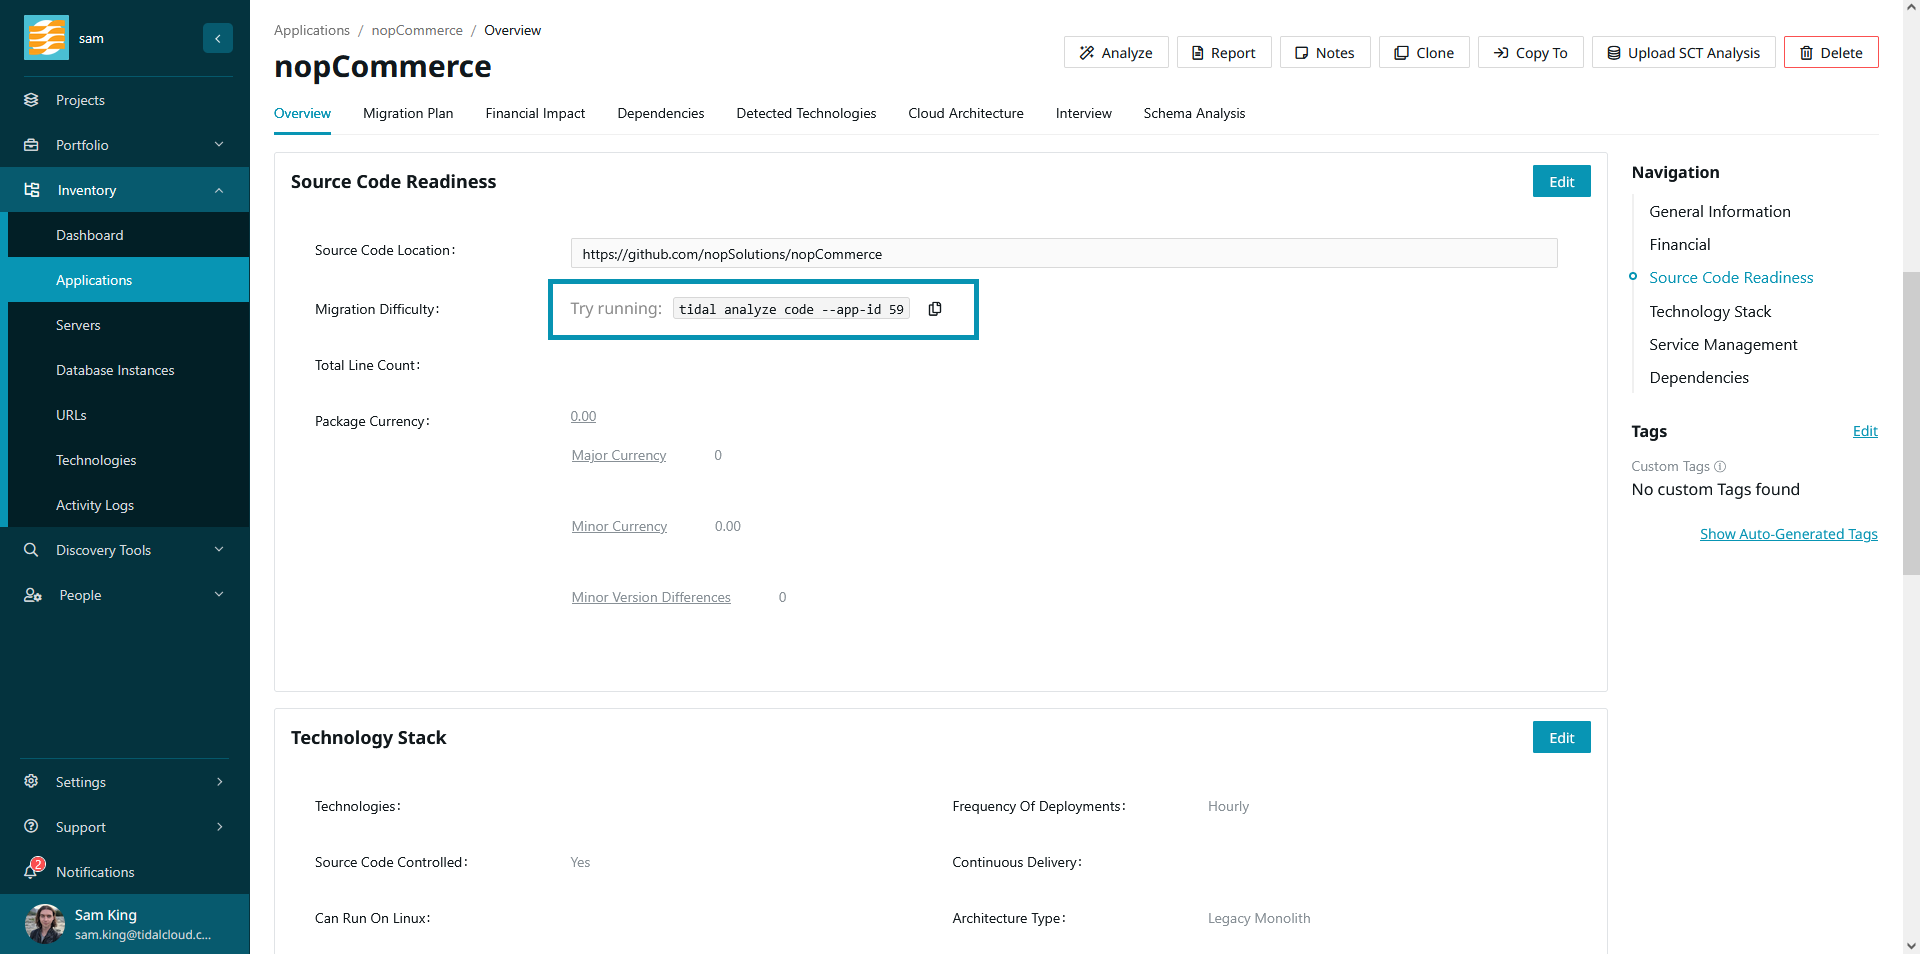
After running the command, the results will be displayed in the ‘Source Code Readiness’ section. You will see a breakdown of the application’s languages by line count, along with a currency score.
The currency score will initially show ‘0’, as we are calculating currency for you behind the scenes. This will be updated once the calculation is completed, typically within 10 minutes.
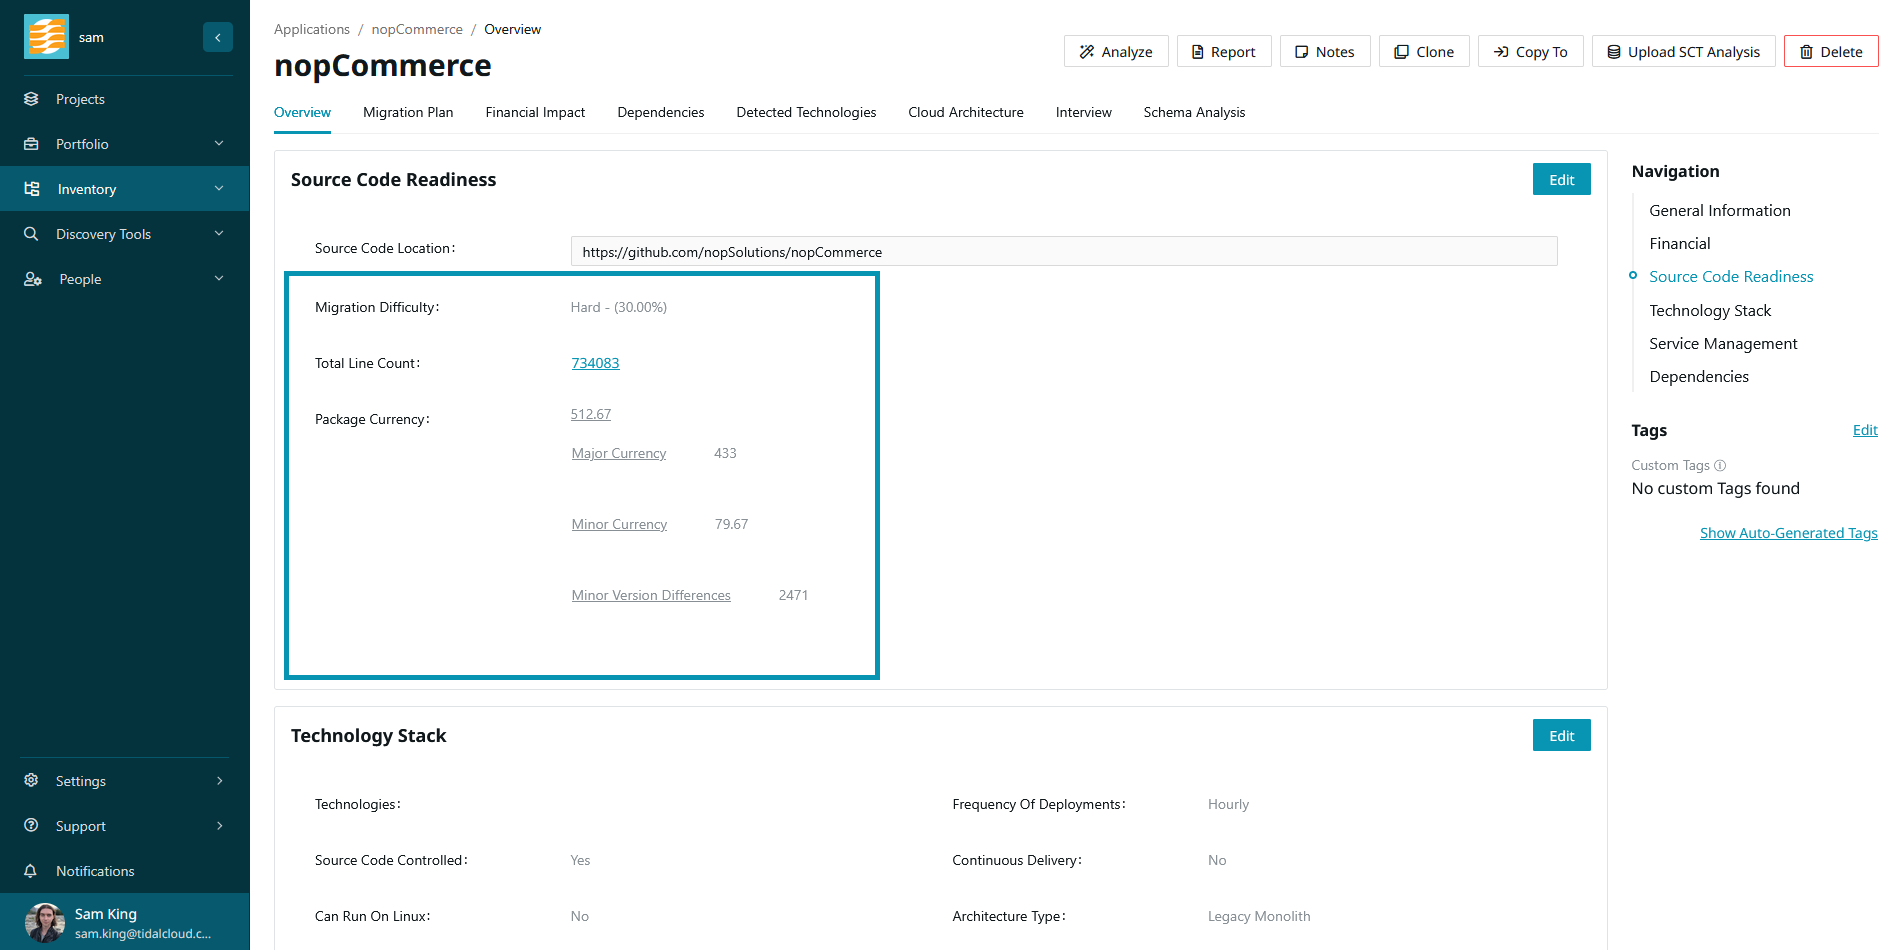
The application currency is calculated by examining each of the application’s dependencies and determining the difference between the version of the dependency being used and the most recent version of that dependency. For example, if an application has a single dependency, and is using version 2.0. At the same time, the most recent version of that dependency is version 4.0, then the application will have a currency score of 2.
The higher the currency score, the more outdated the dependencies of the application are. A high currency score indicates that the app has many outdated dependencies, and may therefore be more difficult to refactor and modernize, as you will need to put more effort into upgrading severely outdated dependencies.
Portfolio Insights
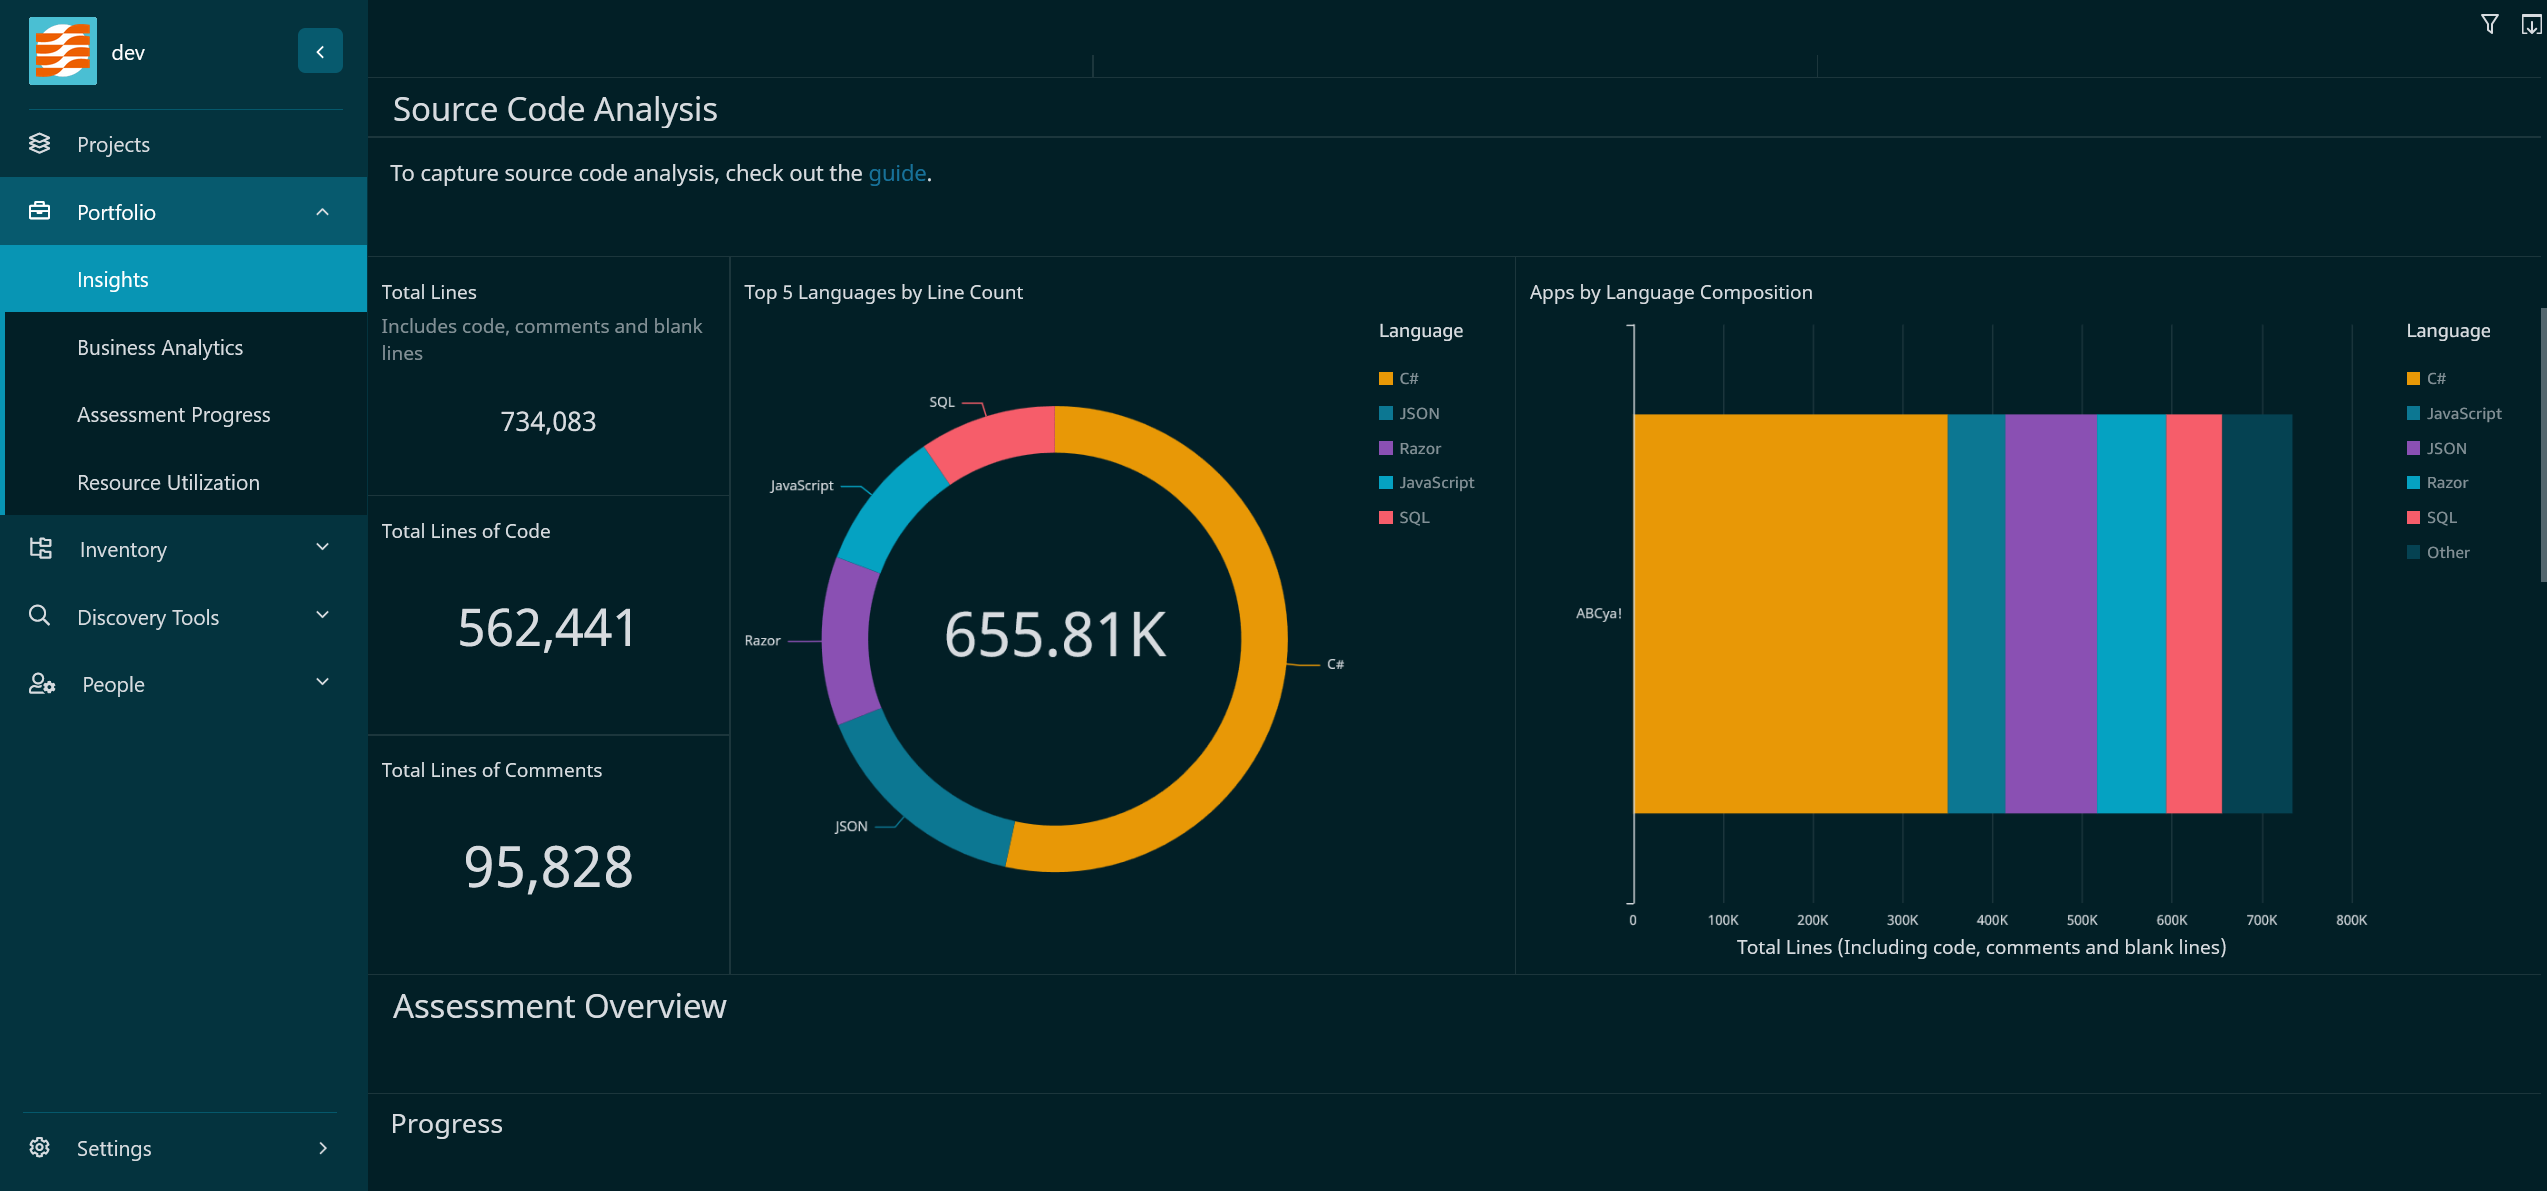
You can visualize source code analysis results for all applications in the workspace by navigating to ‘Insights’ in the navigation sidebar, under ‘Portfolio’. This displays multiple visuals that aggregate various data points from your portfolio, including a dedicated section for source code analysis. Here you can see the top 5 languages used across your portfolio, as well as a breakdown of applications by language composition.
Portfolio Insights data is refreshed every 12 hours and may be outdated. To update the data immediately, navigate to the ‘Preferences’ page under ‘Settings’ in the navigation sidebar. Navigate to the section titled ‘Sync Business Analytics’ and click ‘Trigger sync’.
Step 4: Upload AWS Schema Conversion Tool Results
Running AWS Schema Conversion Tool (SCT) on your database instances can help you uncover valuable insights into the best modernization path for your databases. Accelerator facilitates this by helping you configure SCT and hosting the analysis results directly alongside your database records. You can visualize the results of the analyses and decide which database technology is the best fit when migrating your database to the cloud.
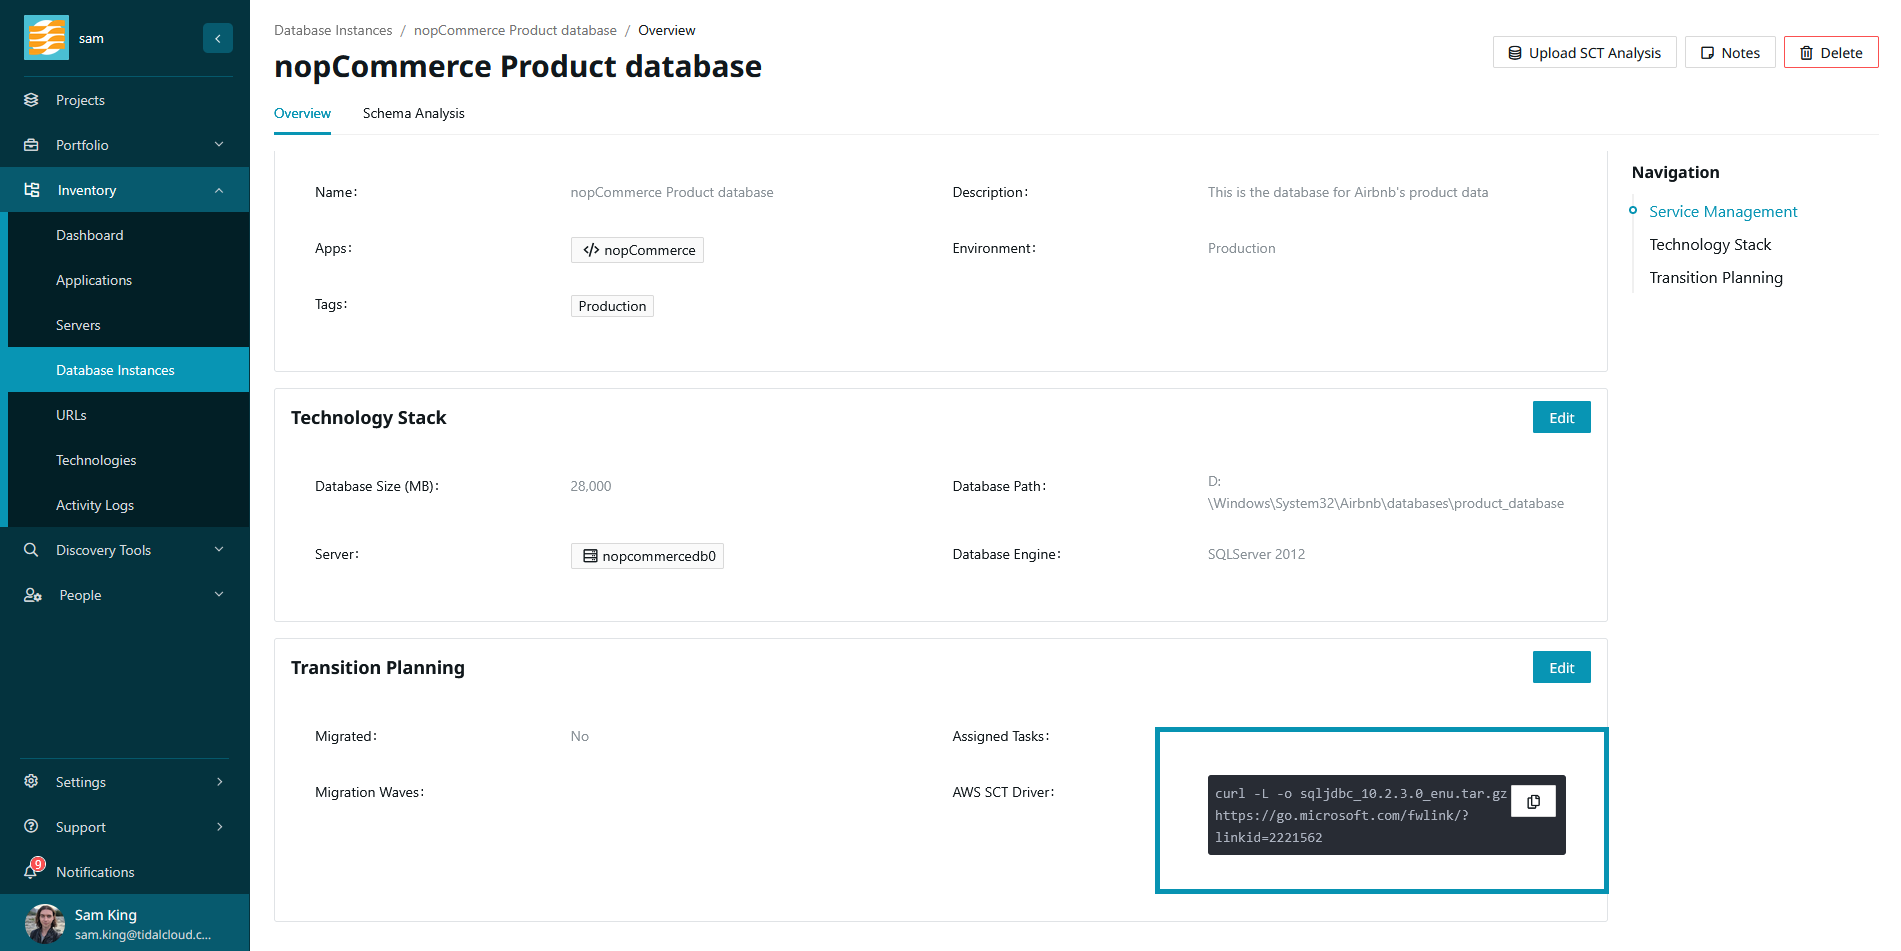
To scan your database using SCT, you must provide the appropriate database driver (JDBC) for your target database instance. Accelerator helps simplify this process by generating a cURL command to download the appropriate JDBC driver for your database.
You can find this in the ‘Transition Planning’ section of your database instance overview.
Once you have configured SCT, you can use it to generate assessment reports on target cloud database technologies. SCT allows you to export this as a folder containing three .csv files.
You can upload these reports directly to your database instance in Accelerator by navigating to the ‘Schema Analysis’ tab of your database record.
You need to generate different reports for different target database technologies.
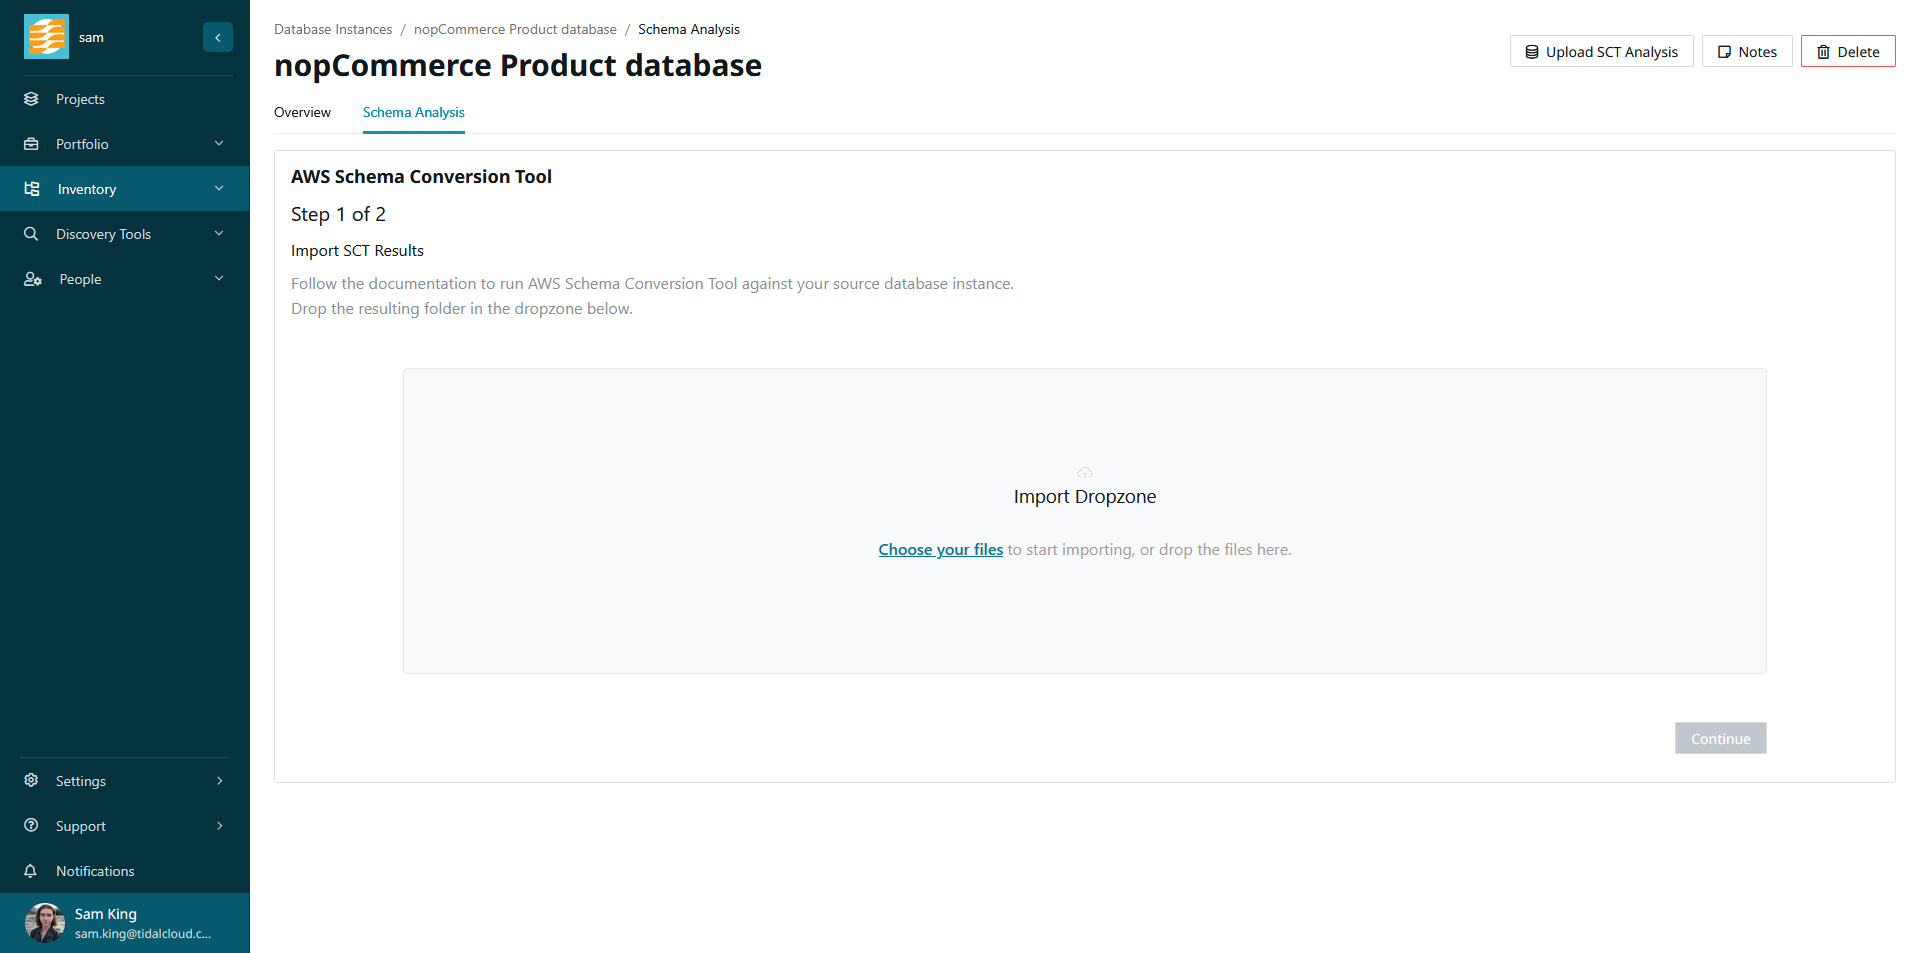
For each report you wish to upload, you must upload all three result .csv files at once, as Accelerator needs all three files to generate your visuals. Drag and drop these three files into the dropzone, or use the file explorer to upload them. Follow the steps of the import wizard to preview and upload your report.
For each report you upload, we infer the name of the source database schema and then aggregate and visualize the results.
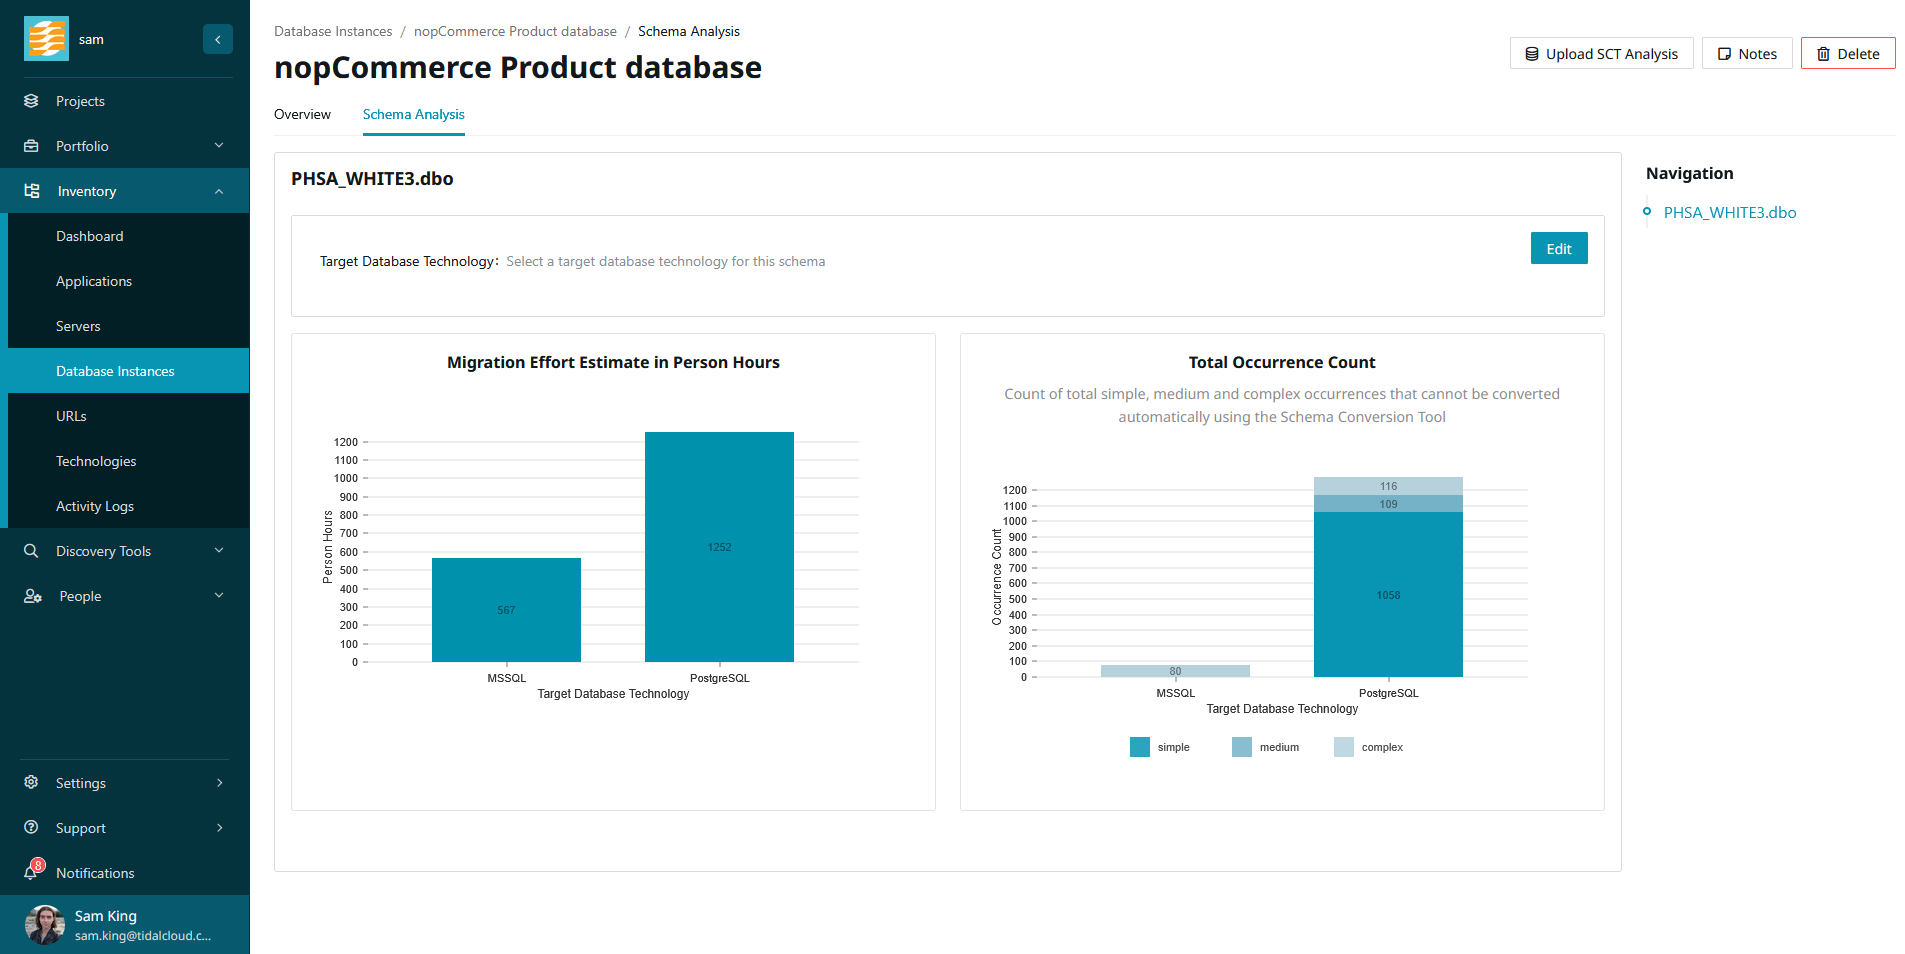
To upload additional reports, click the ‘Upload SCT Analysis’ button in the top toolbar of the database record.
You can compare results and make a decision on which database technology to target by selecting the target database technology for the schema.
Step 5: Organize your resources into a Project
When managing numerous applications during cloud migration, organizing them into project groups streamlines progress tracking, aligns assessment goals, and enables parallel execution across teams. Assigning your applications to a project also unlocks advanced features in Accelerator, such as financial impact, cloud instance target recommendations, and the modernization presentation.
First, navigate to ‘Projects’ in the navigation sidebar, then click ‘Add Project’.
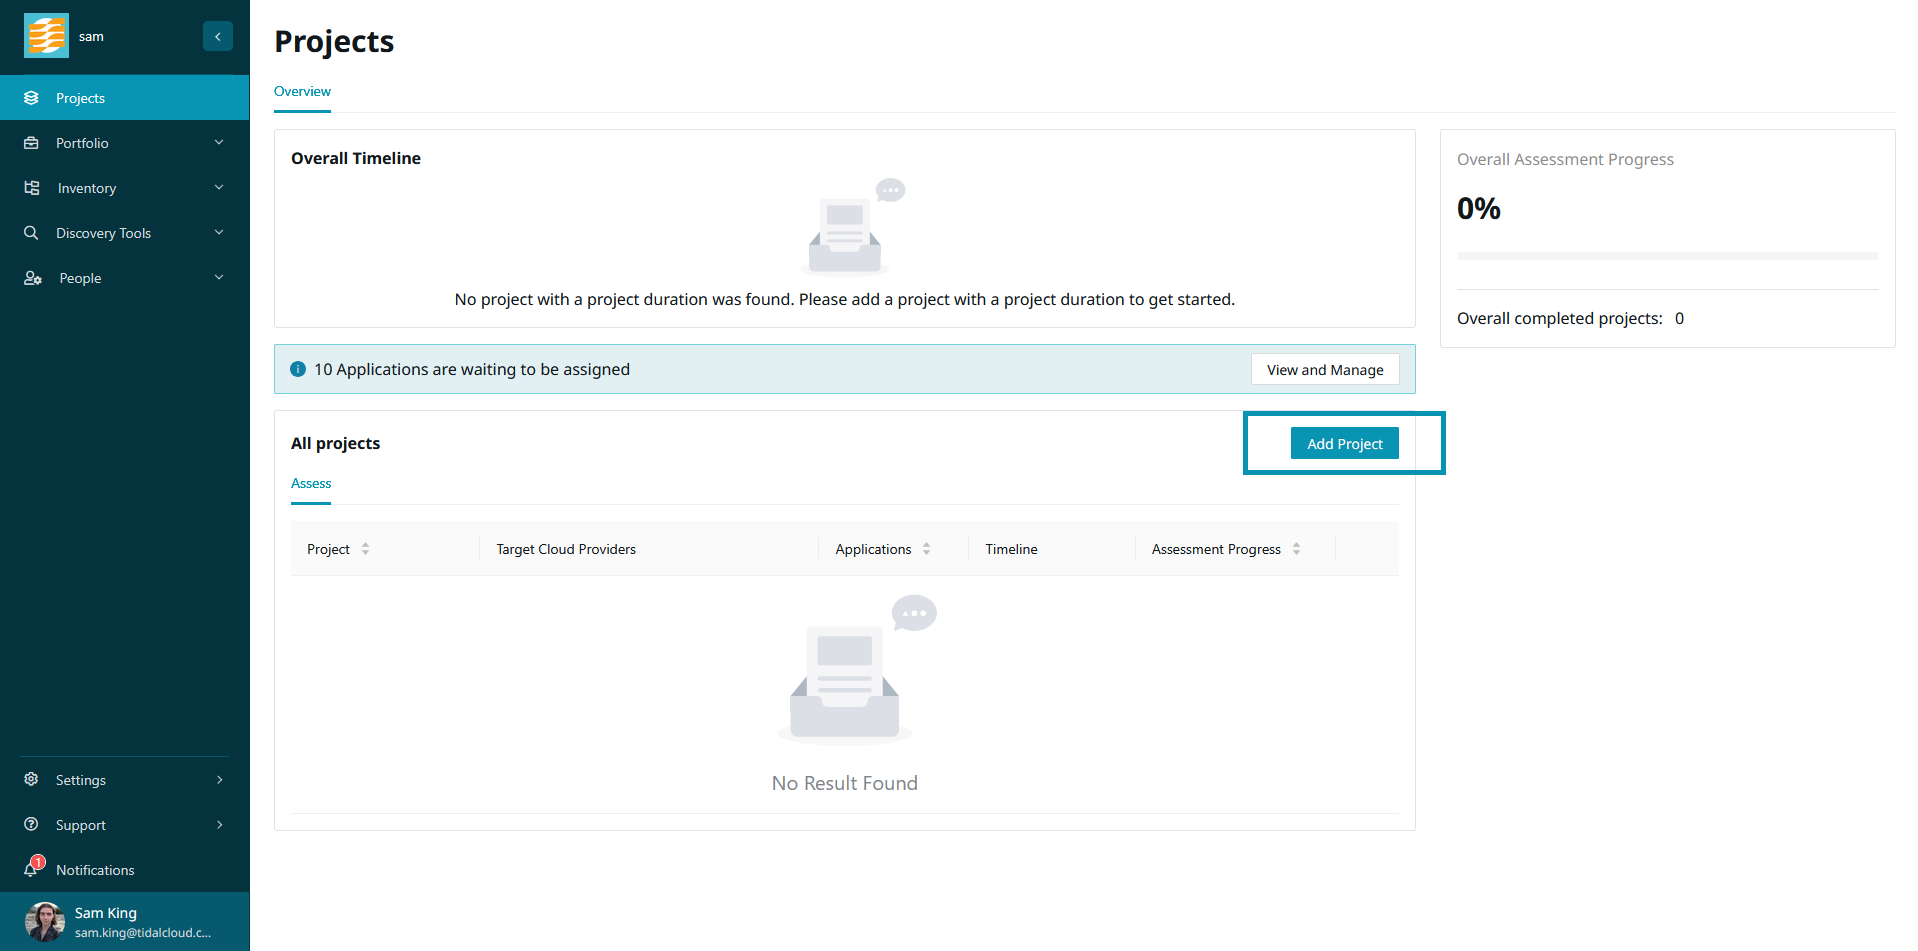
For a Modernization Assessment, the minimum amount of data that we need to enter when creating a project is the name and the target cloud provider. Set these and click ‘Save’.
Next, we will assign applications to the project. You’ll want to assign all applications which are in scope for the Modernization Assessment. You can do this by navigating to the ‘Applications’ page under ‘Inventory’ in the navigation sidebar, checking the box of all applications you’d like to assign, then selecting ‘Assign to Project’ from the bulk actions dropdown menu.
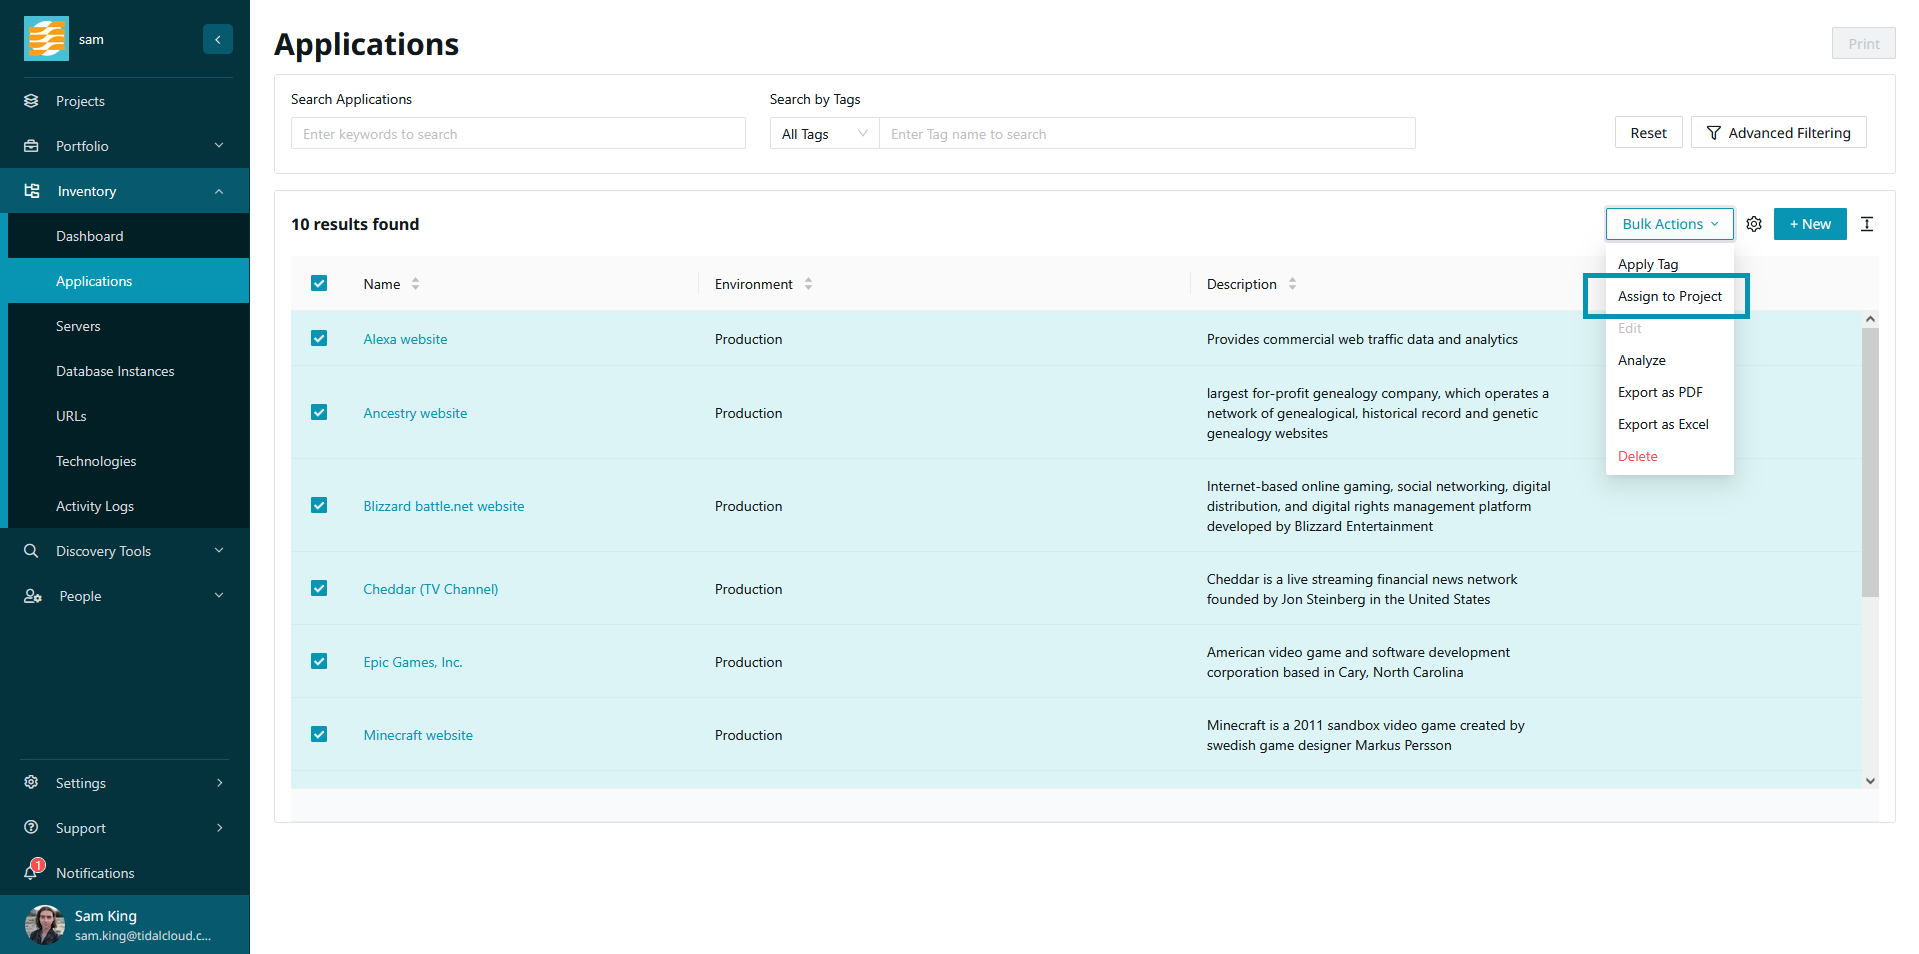
You can now navigate back to the project, and you should see the applications listed in the ‘Apps’ tab. You will also see any servers which were associated with the applications listed in the ‘Servers’ tab.
For more details about creating and working with projects, see our documentation here.
Step 6: Generate Cloud Instance Targets
Once we have enough data about your servers in Tidal Accelerator, we automatically generate cloud instance target recommendations. These recommendations are based on the resources allocated to your servers, such as RAM, storage and CPU. For more details on how we generate cloud instance targets, please refer to this guide.
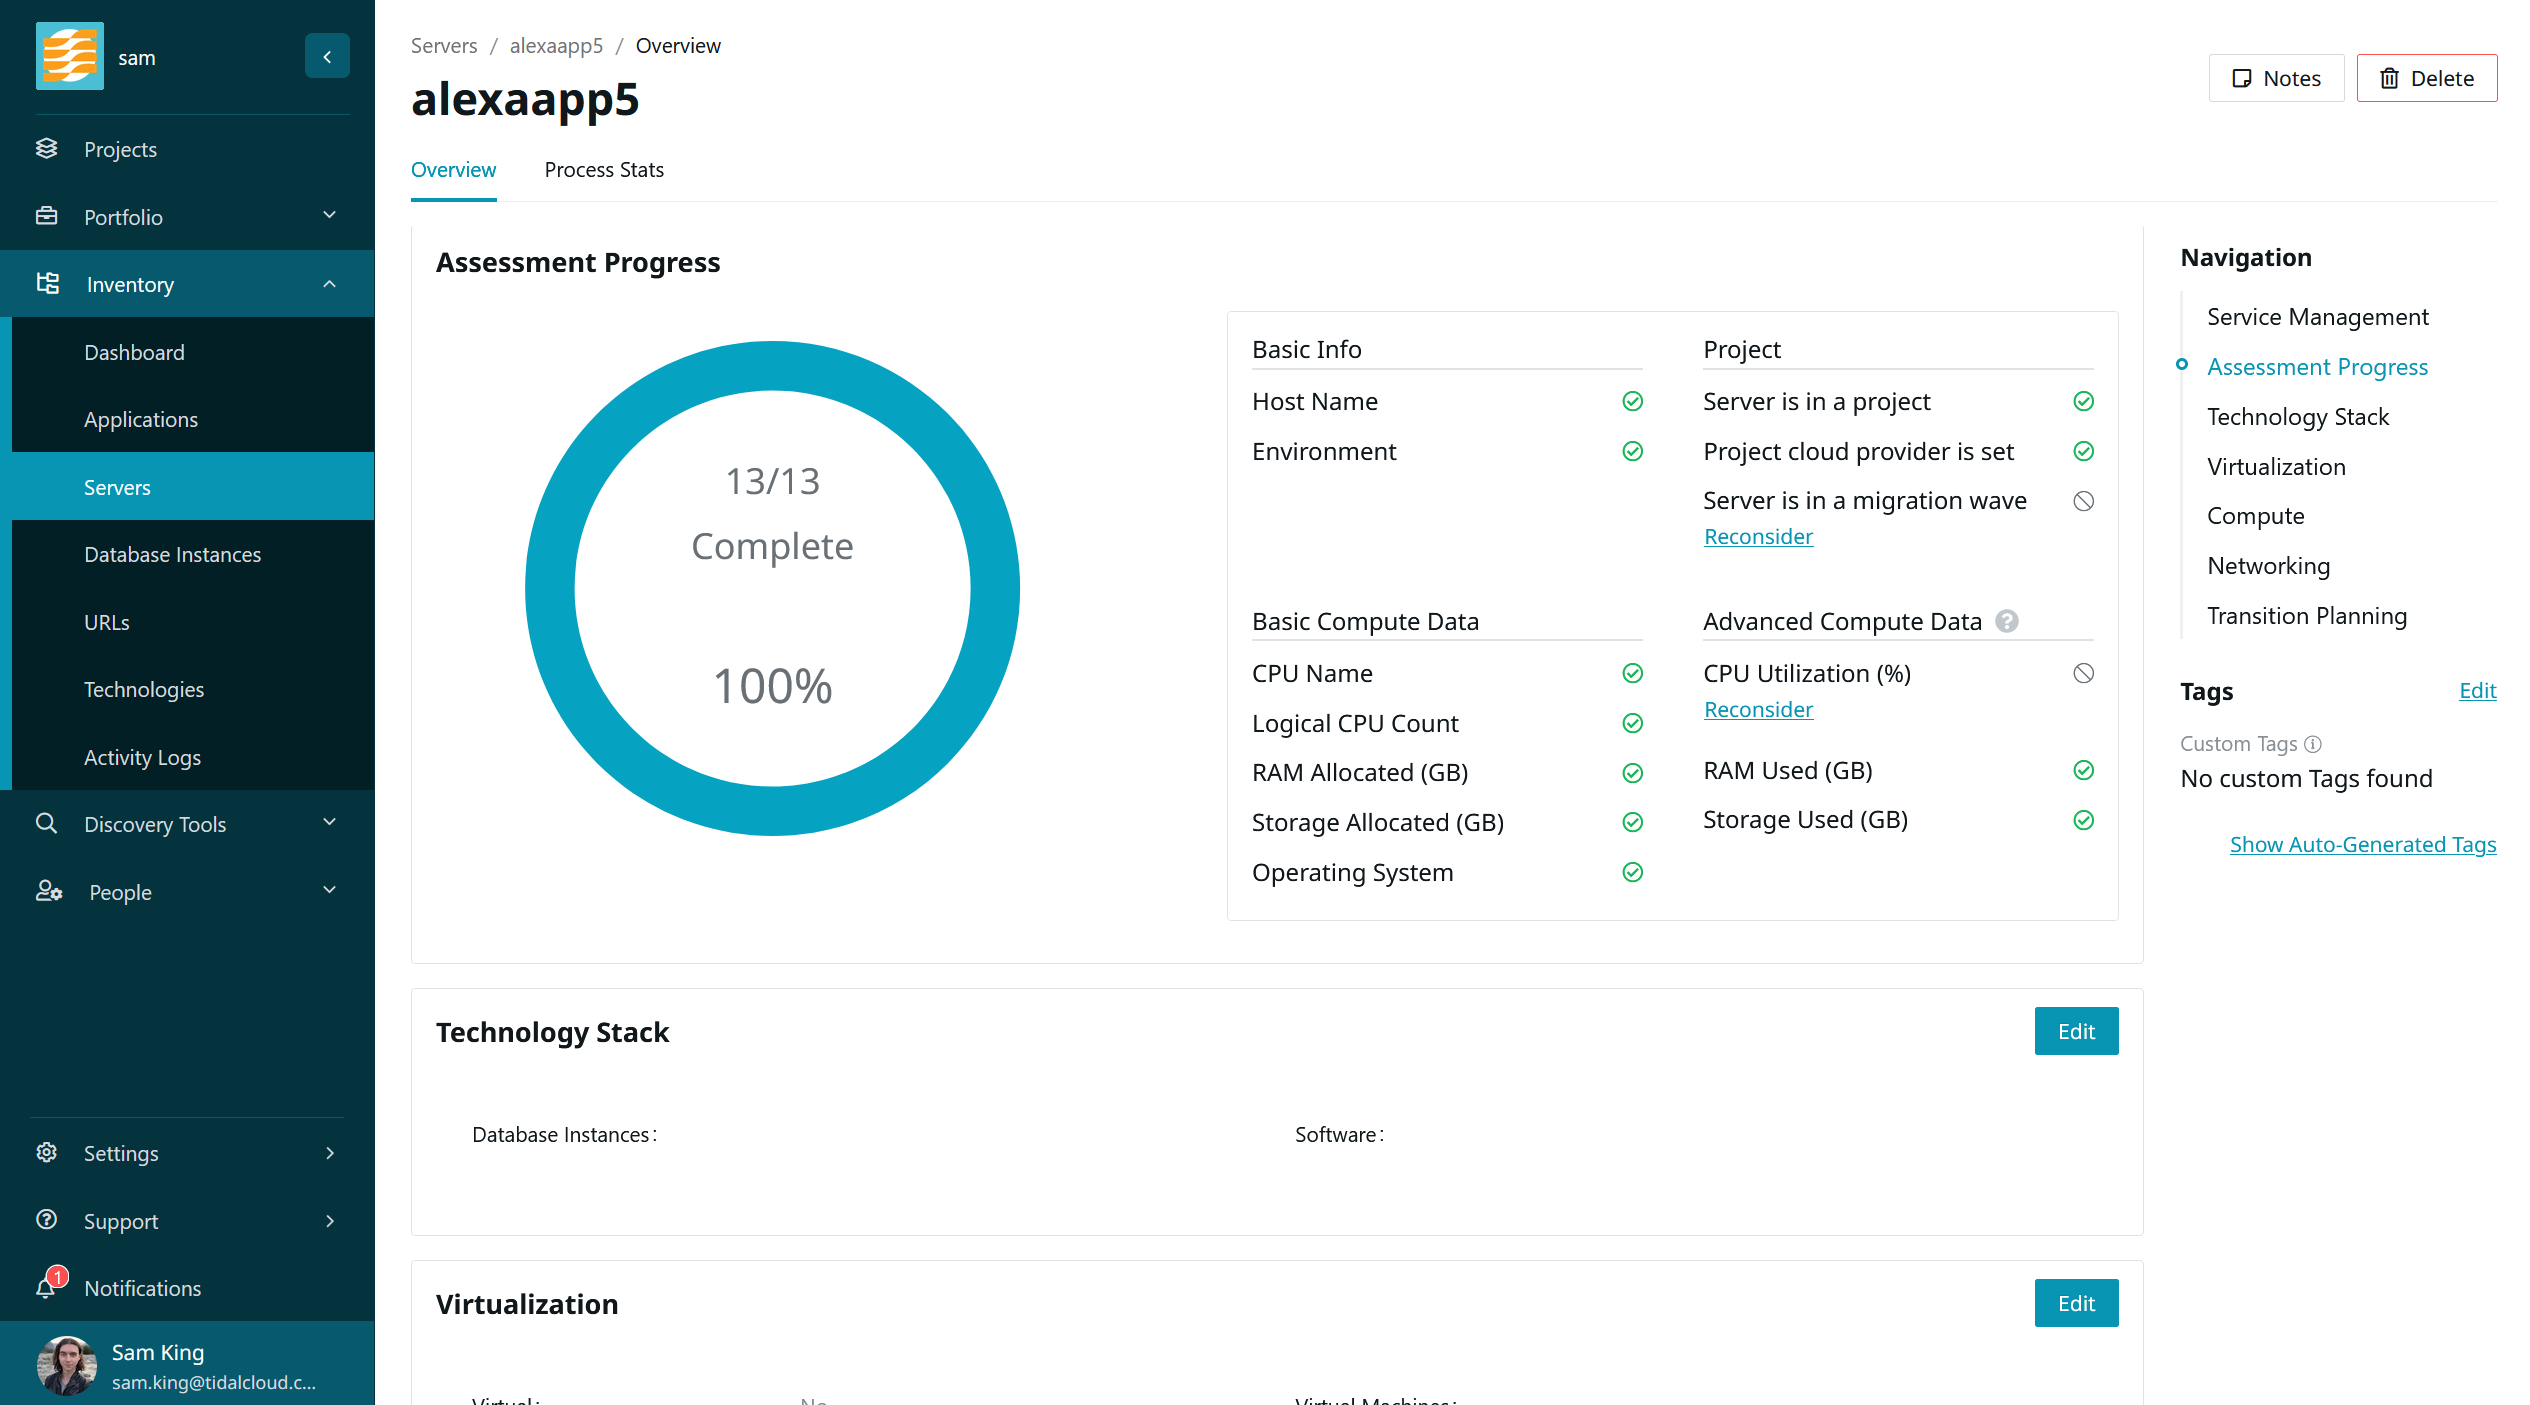
If you are unsure about why a specific server does not have a cloud instance target, you can check the assessment progress widget on the server page. Navigate to the server in question, and you will find this in the ‘Assessment Progress’ section of the server overview.
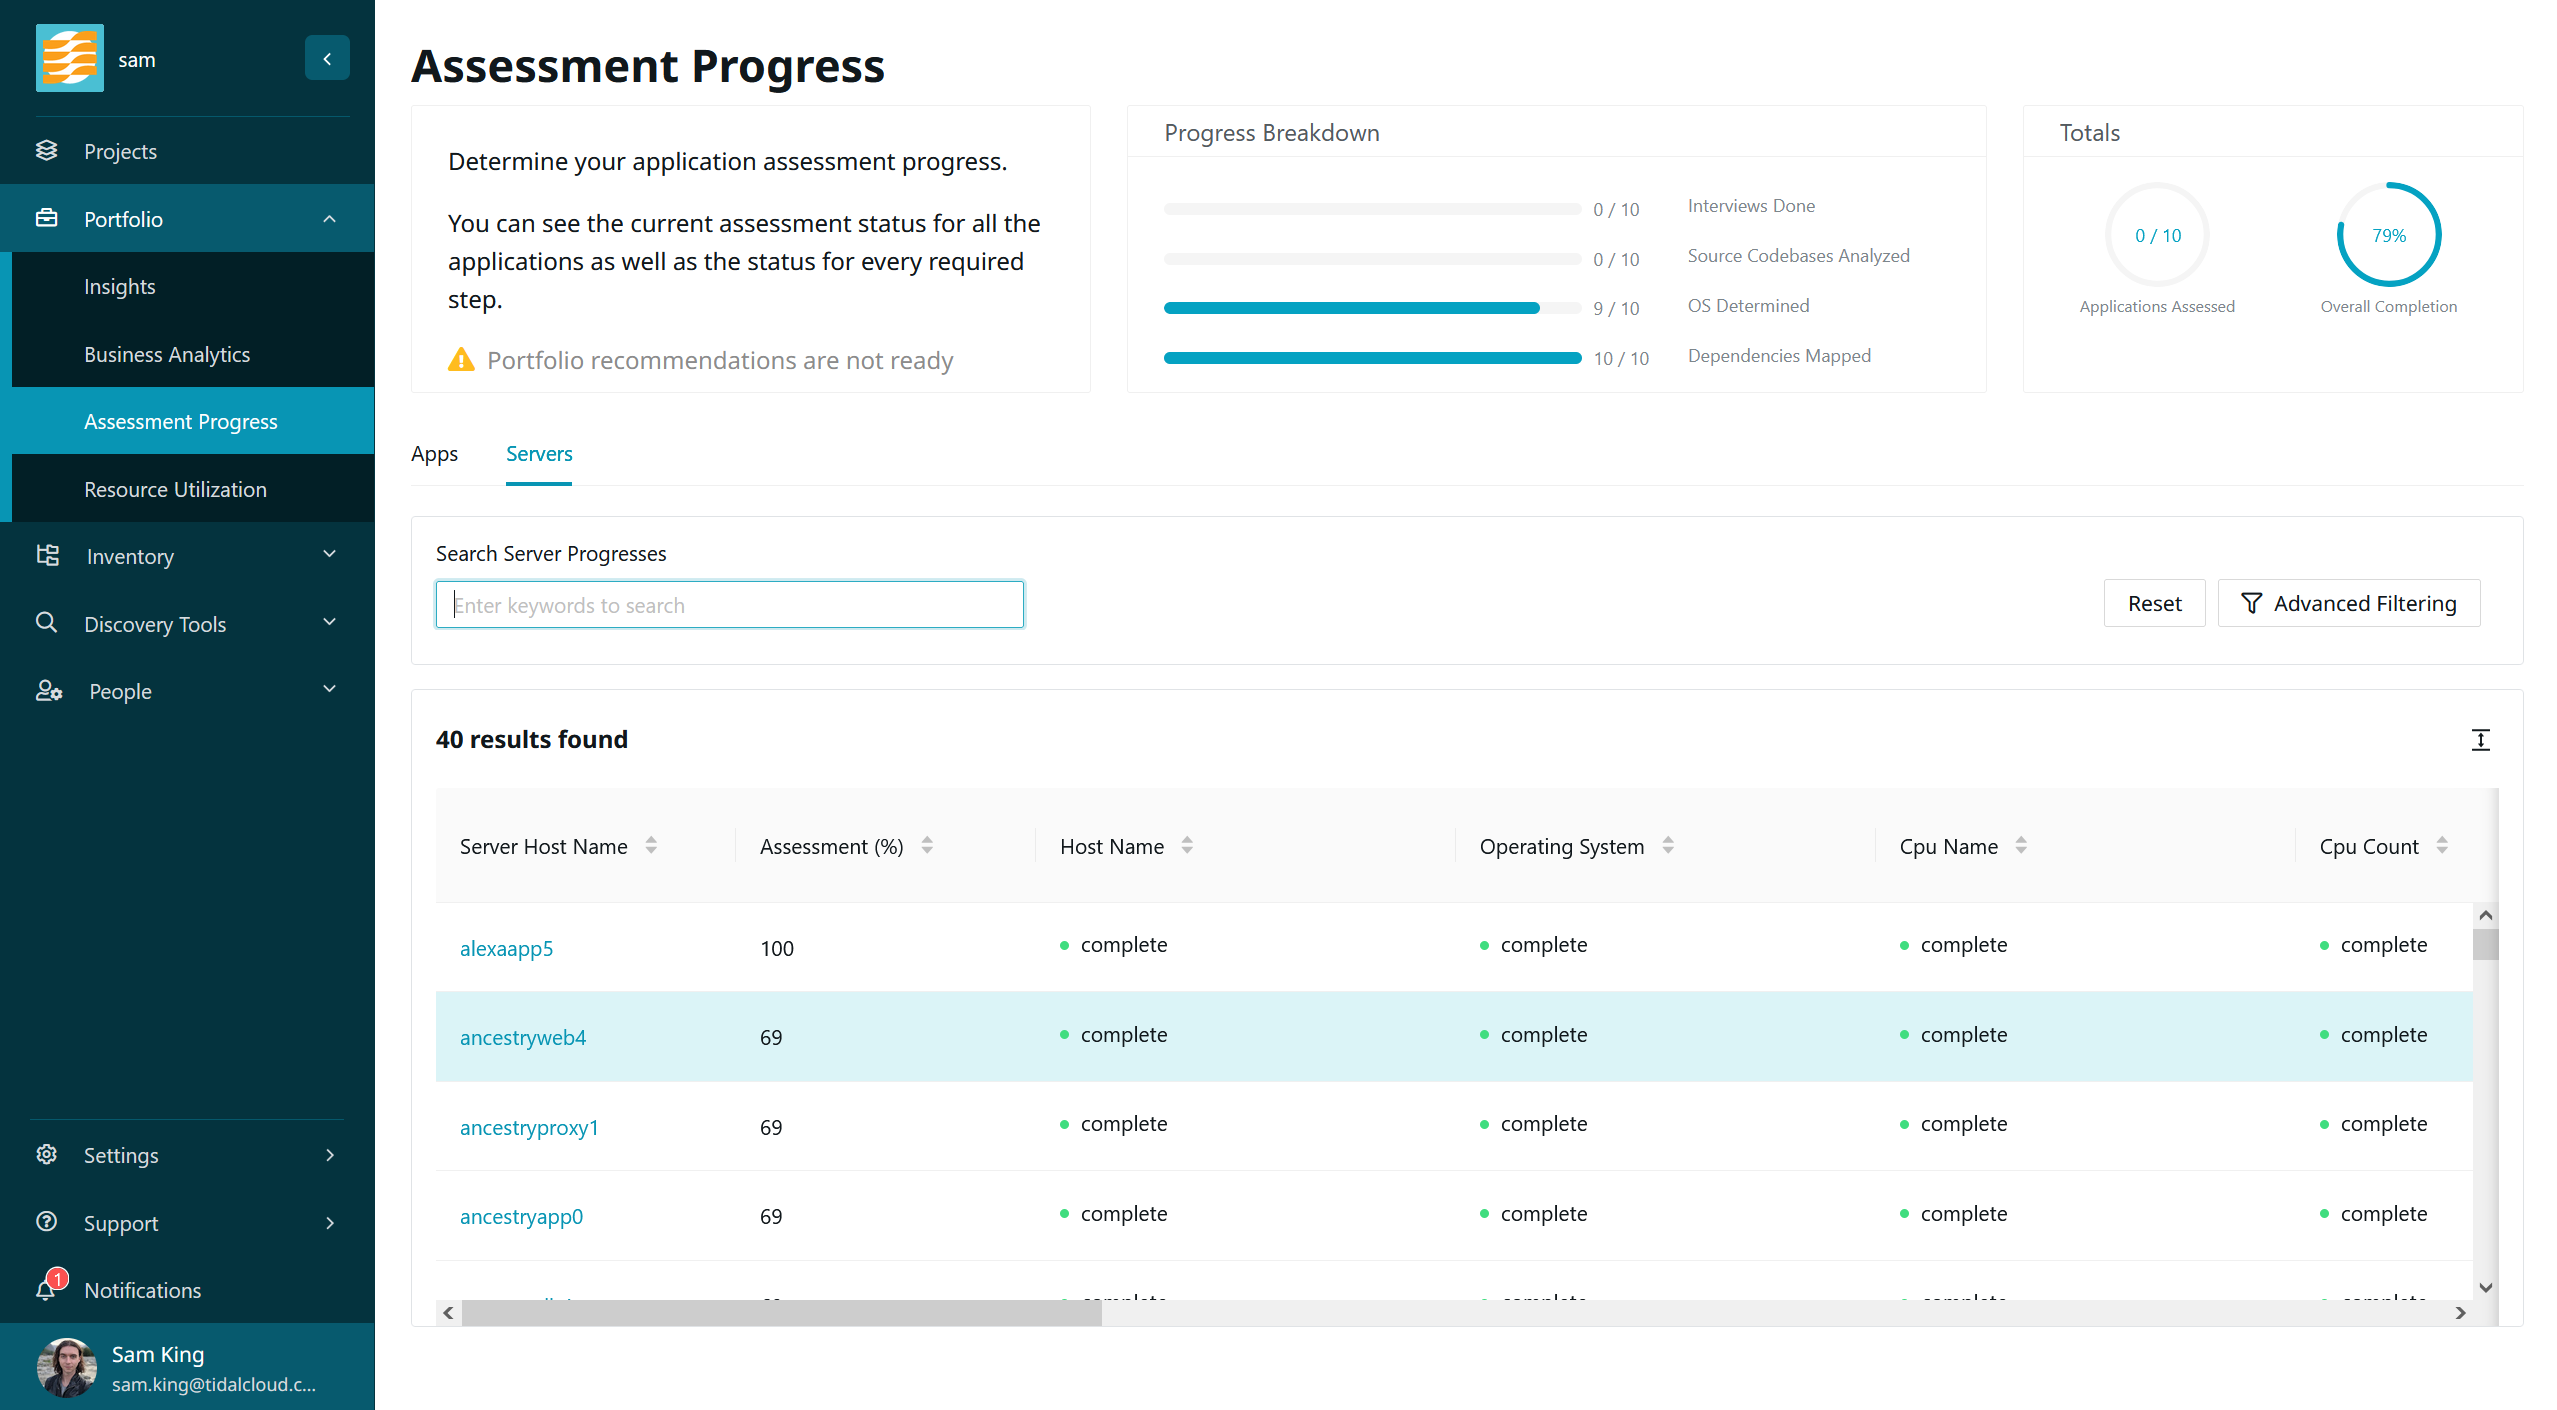
You can check progress for all servers in the workspace by navigating to ‘Assessment Progress’ under the ‘Inventory’ section of the navigation sidebar. Here you will find application assessment progress and server assessment progress in separate tabs.
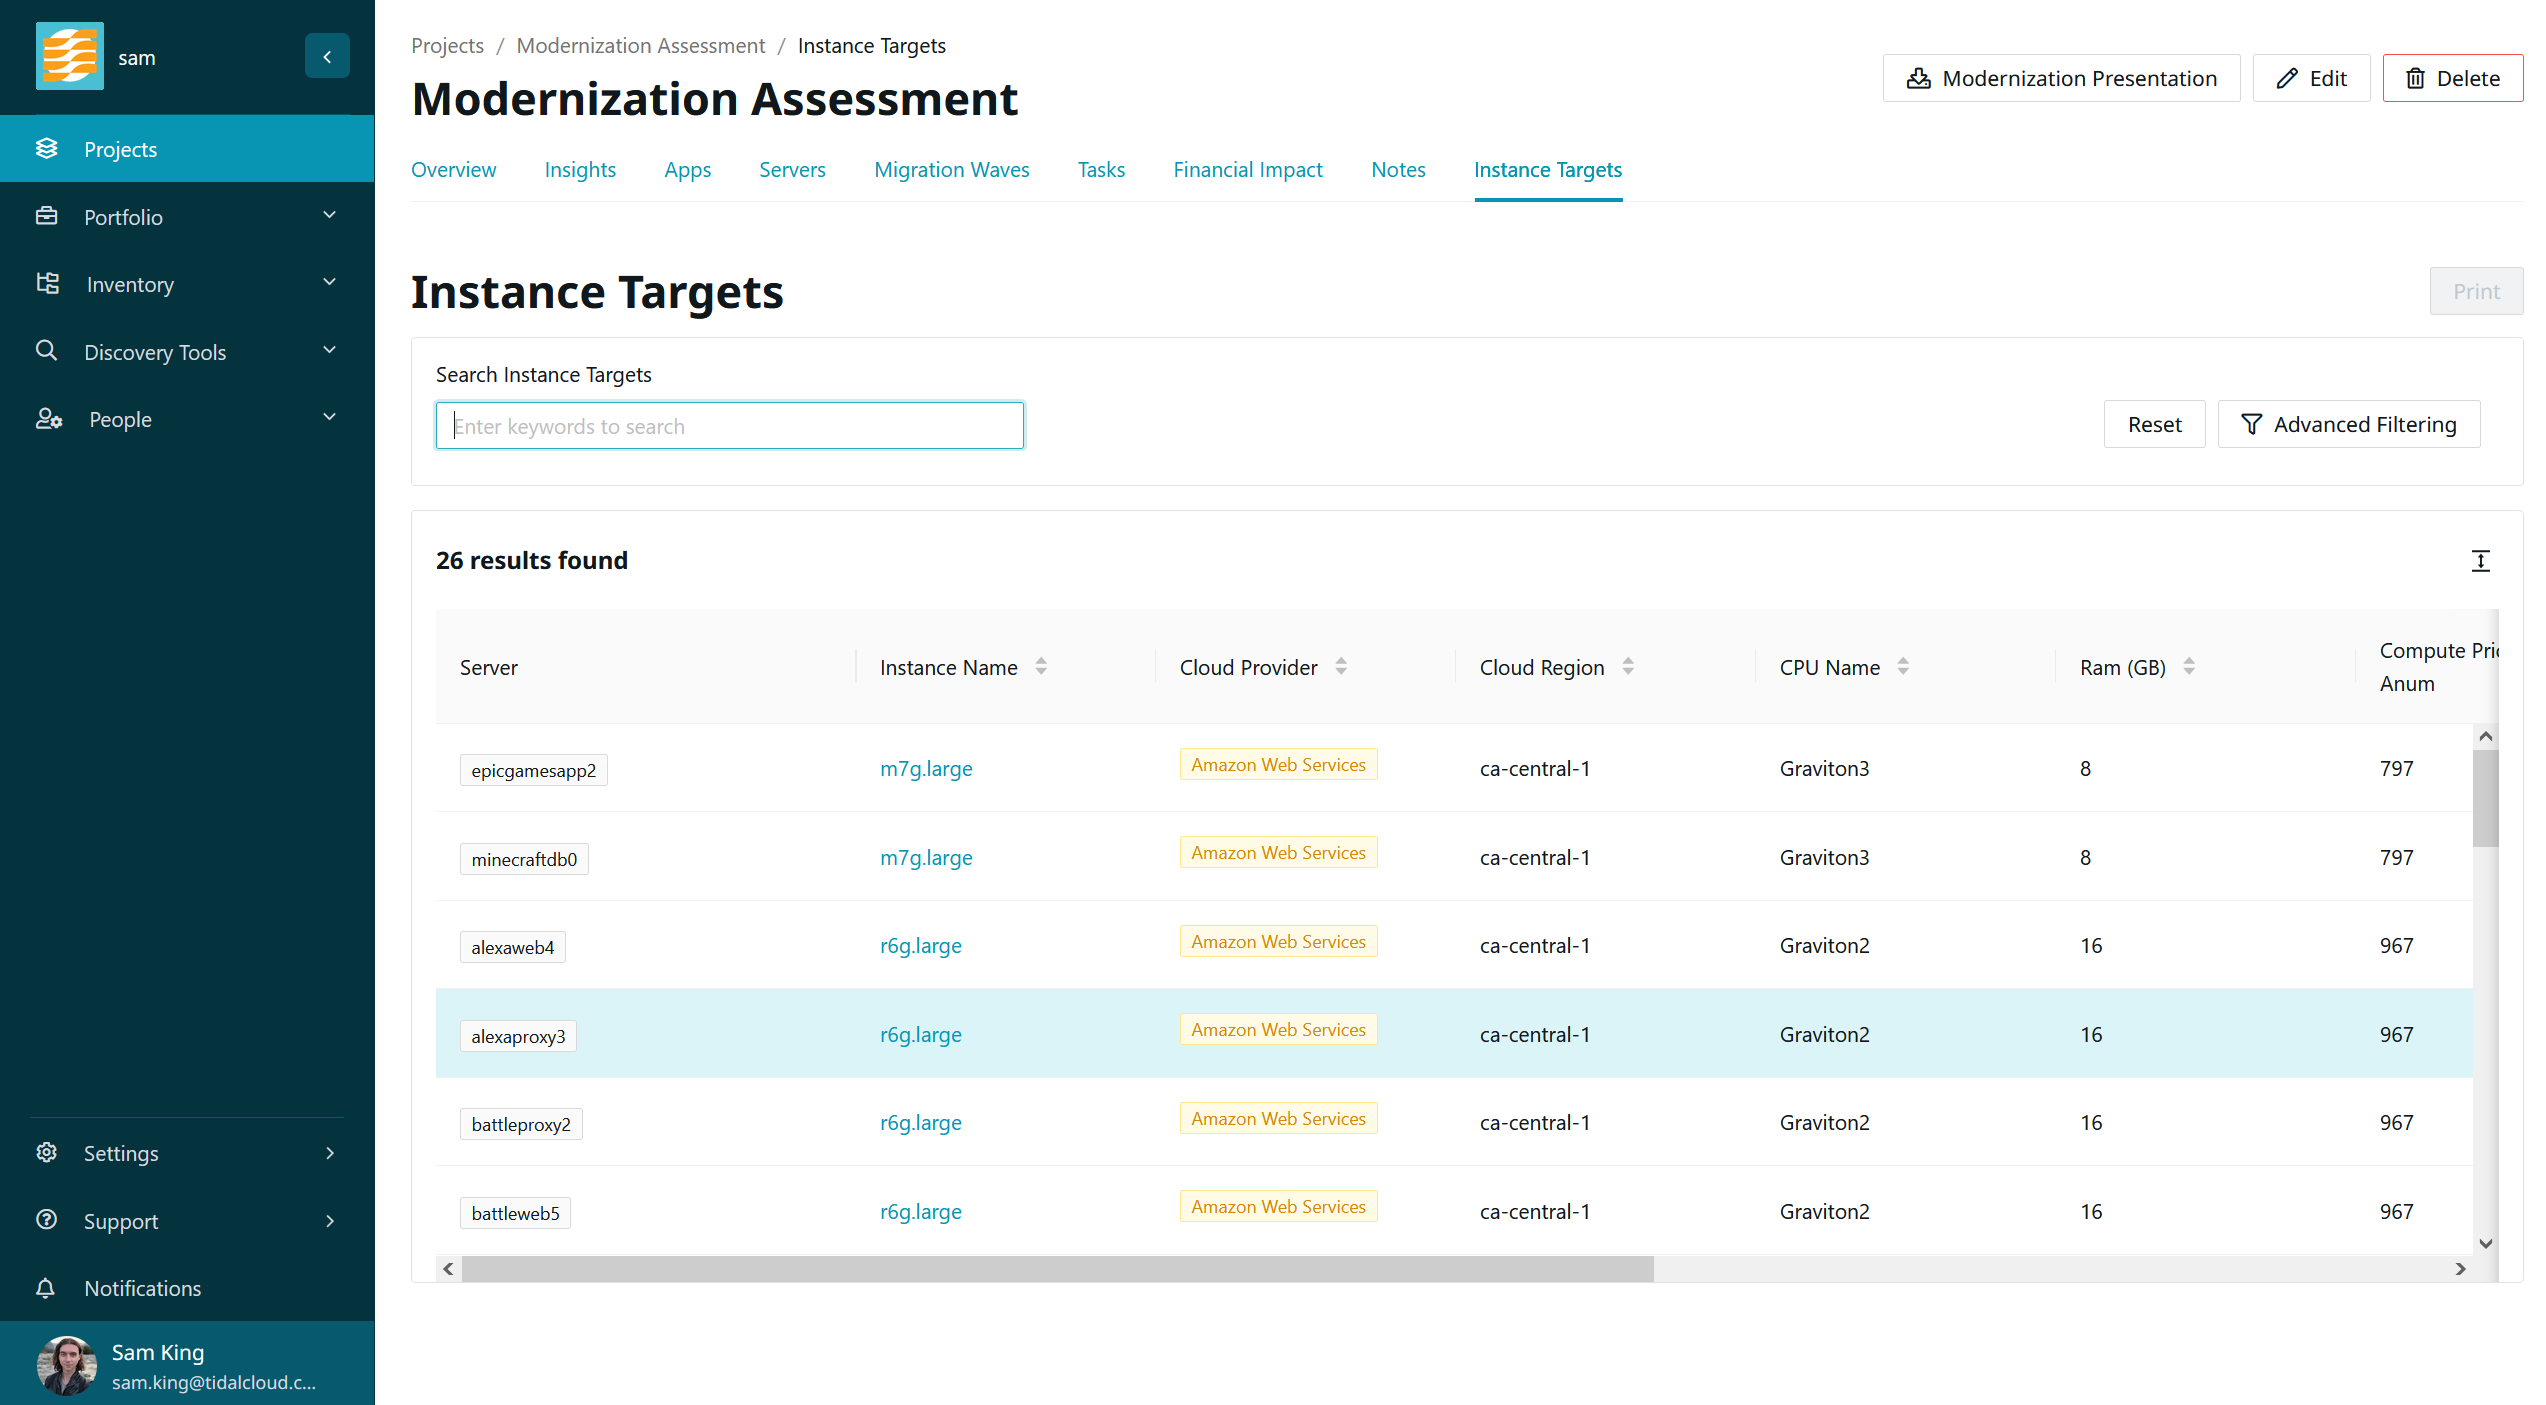
Details about all cloud instance targets for servers in your project are aggregated on the ‘Instance Targets’ tab of the project page. Here, you can find details such as the instance name, cloud region, and which CPU is being used by the cloud instance.
You can set a cloud region for the entire project, and override this for specific servers. Whenever relevant details about your servers change (for example, the amount of RAM allocated is updated), we automatically regenerate a cloud instance target for that server. This way, as you discover more data about your servers, the cloud instance target recommendations become more and more accurate over time.
Step 7: Set Application Insights and Recommended Steps (Optional)
Now that we have sufficient data about your applications, servers and database instances, you can generate insights and recommended steps for your applications. Doing this is optional; however, these datapoints appear in the Modernization Assessment PowerPoint presentation, so it is recommended that you complete this step.
Application Insights
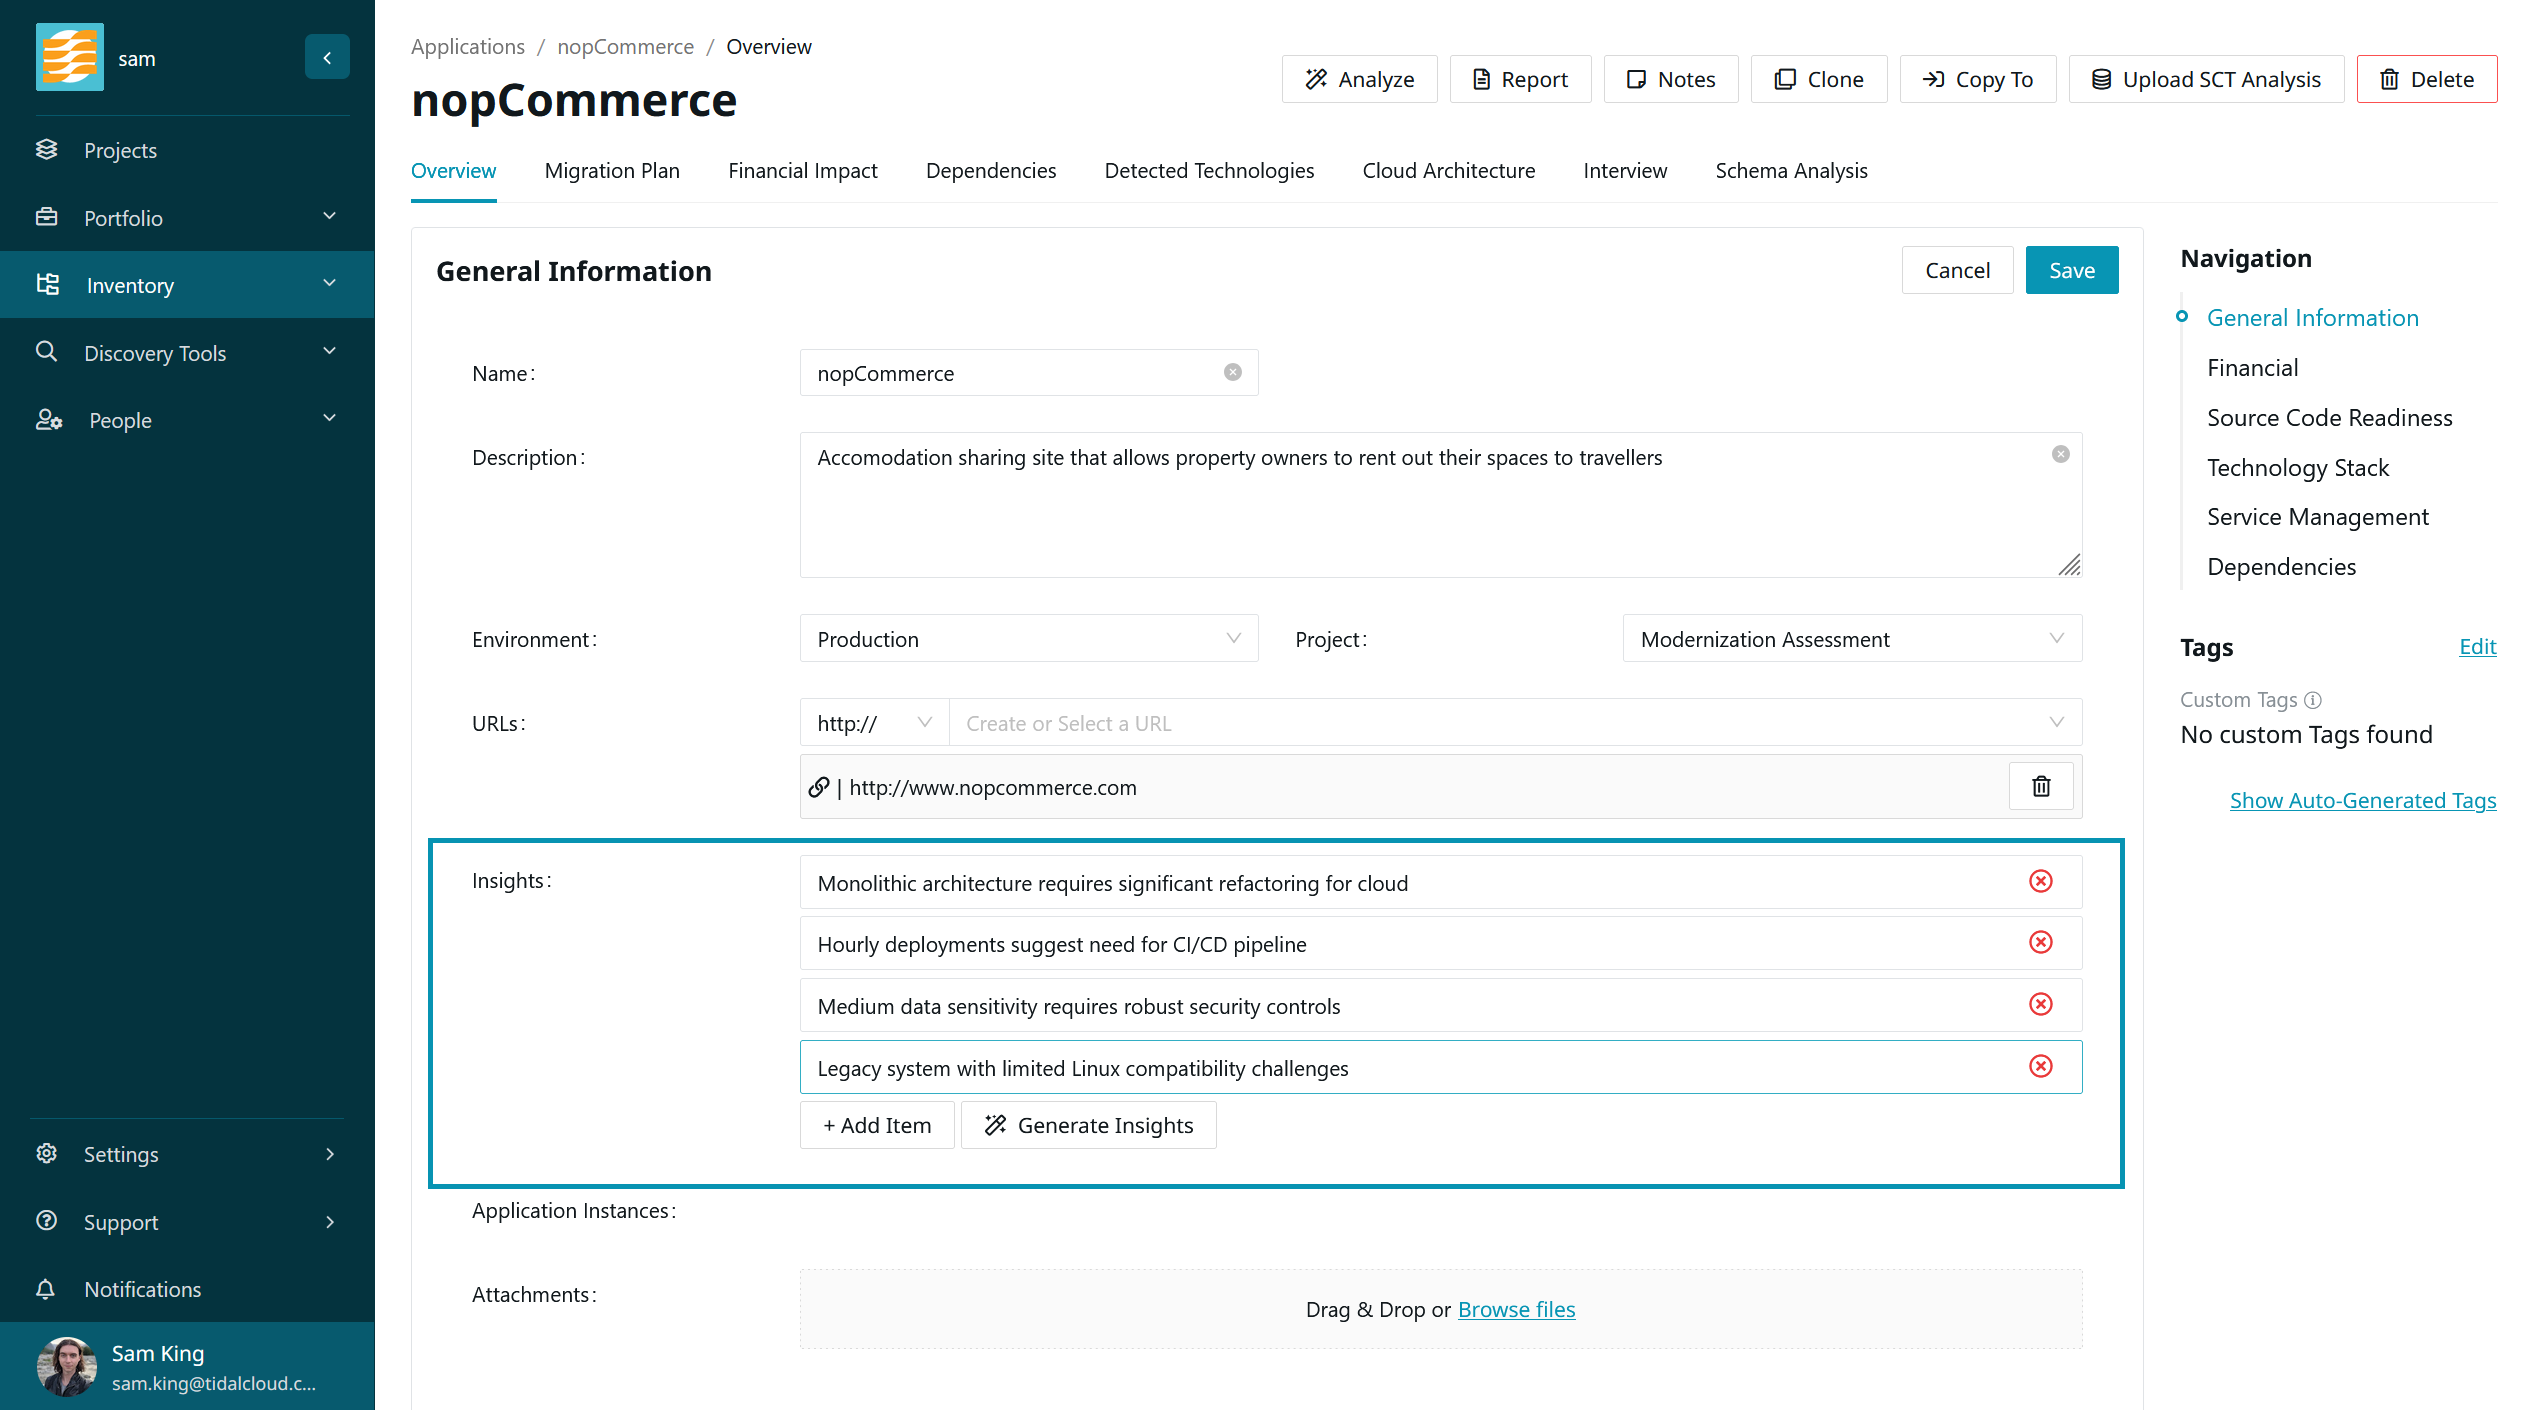
Tidal Accelerator provides a seamless, AI-driven approach to generating application insights. Navigate to the application page, and you will find the field ‘Insights’ in the ‘General Information’ section. Edit this section, and you will be shown a button labelled ‘Generate Insights’. Click this to automatically populate insights for this application based on the data that you’ve provided so far.
These insights are generated using a large language model; therefore, please review them carefully before saving. You can alter the insights, remove them or add new ones before saving them to the application.
Recommended Steps
Accelerator can generate a list of recommended ‘next steps’ for your application migration, based on the selected transition type of the application.
Navigate to the ‘Migration Plan’ tab of the application record. You will find the fields ‘Transition Type’ and ‘Recommended Steps’ in the ‘Transition Planning’ section.
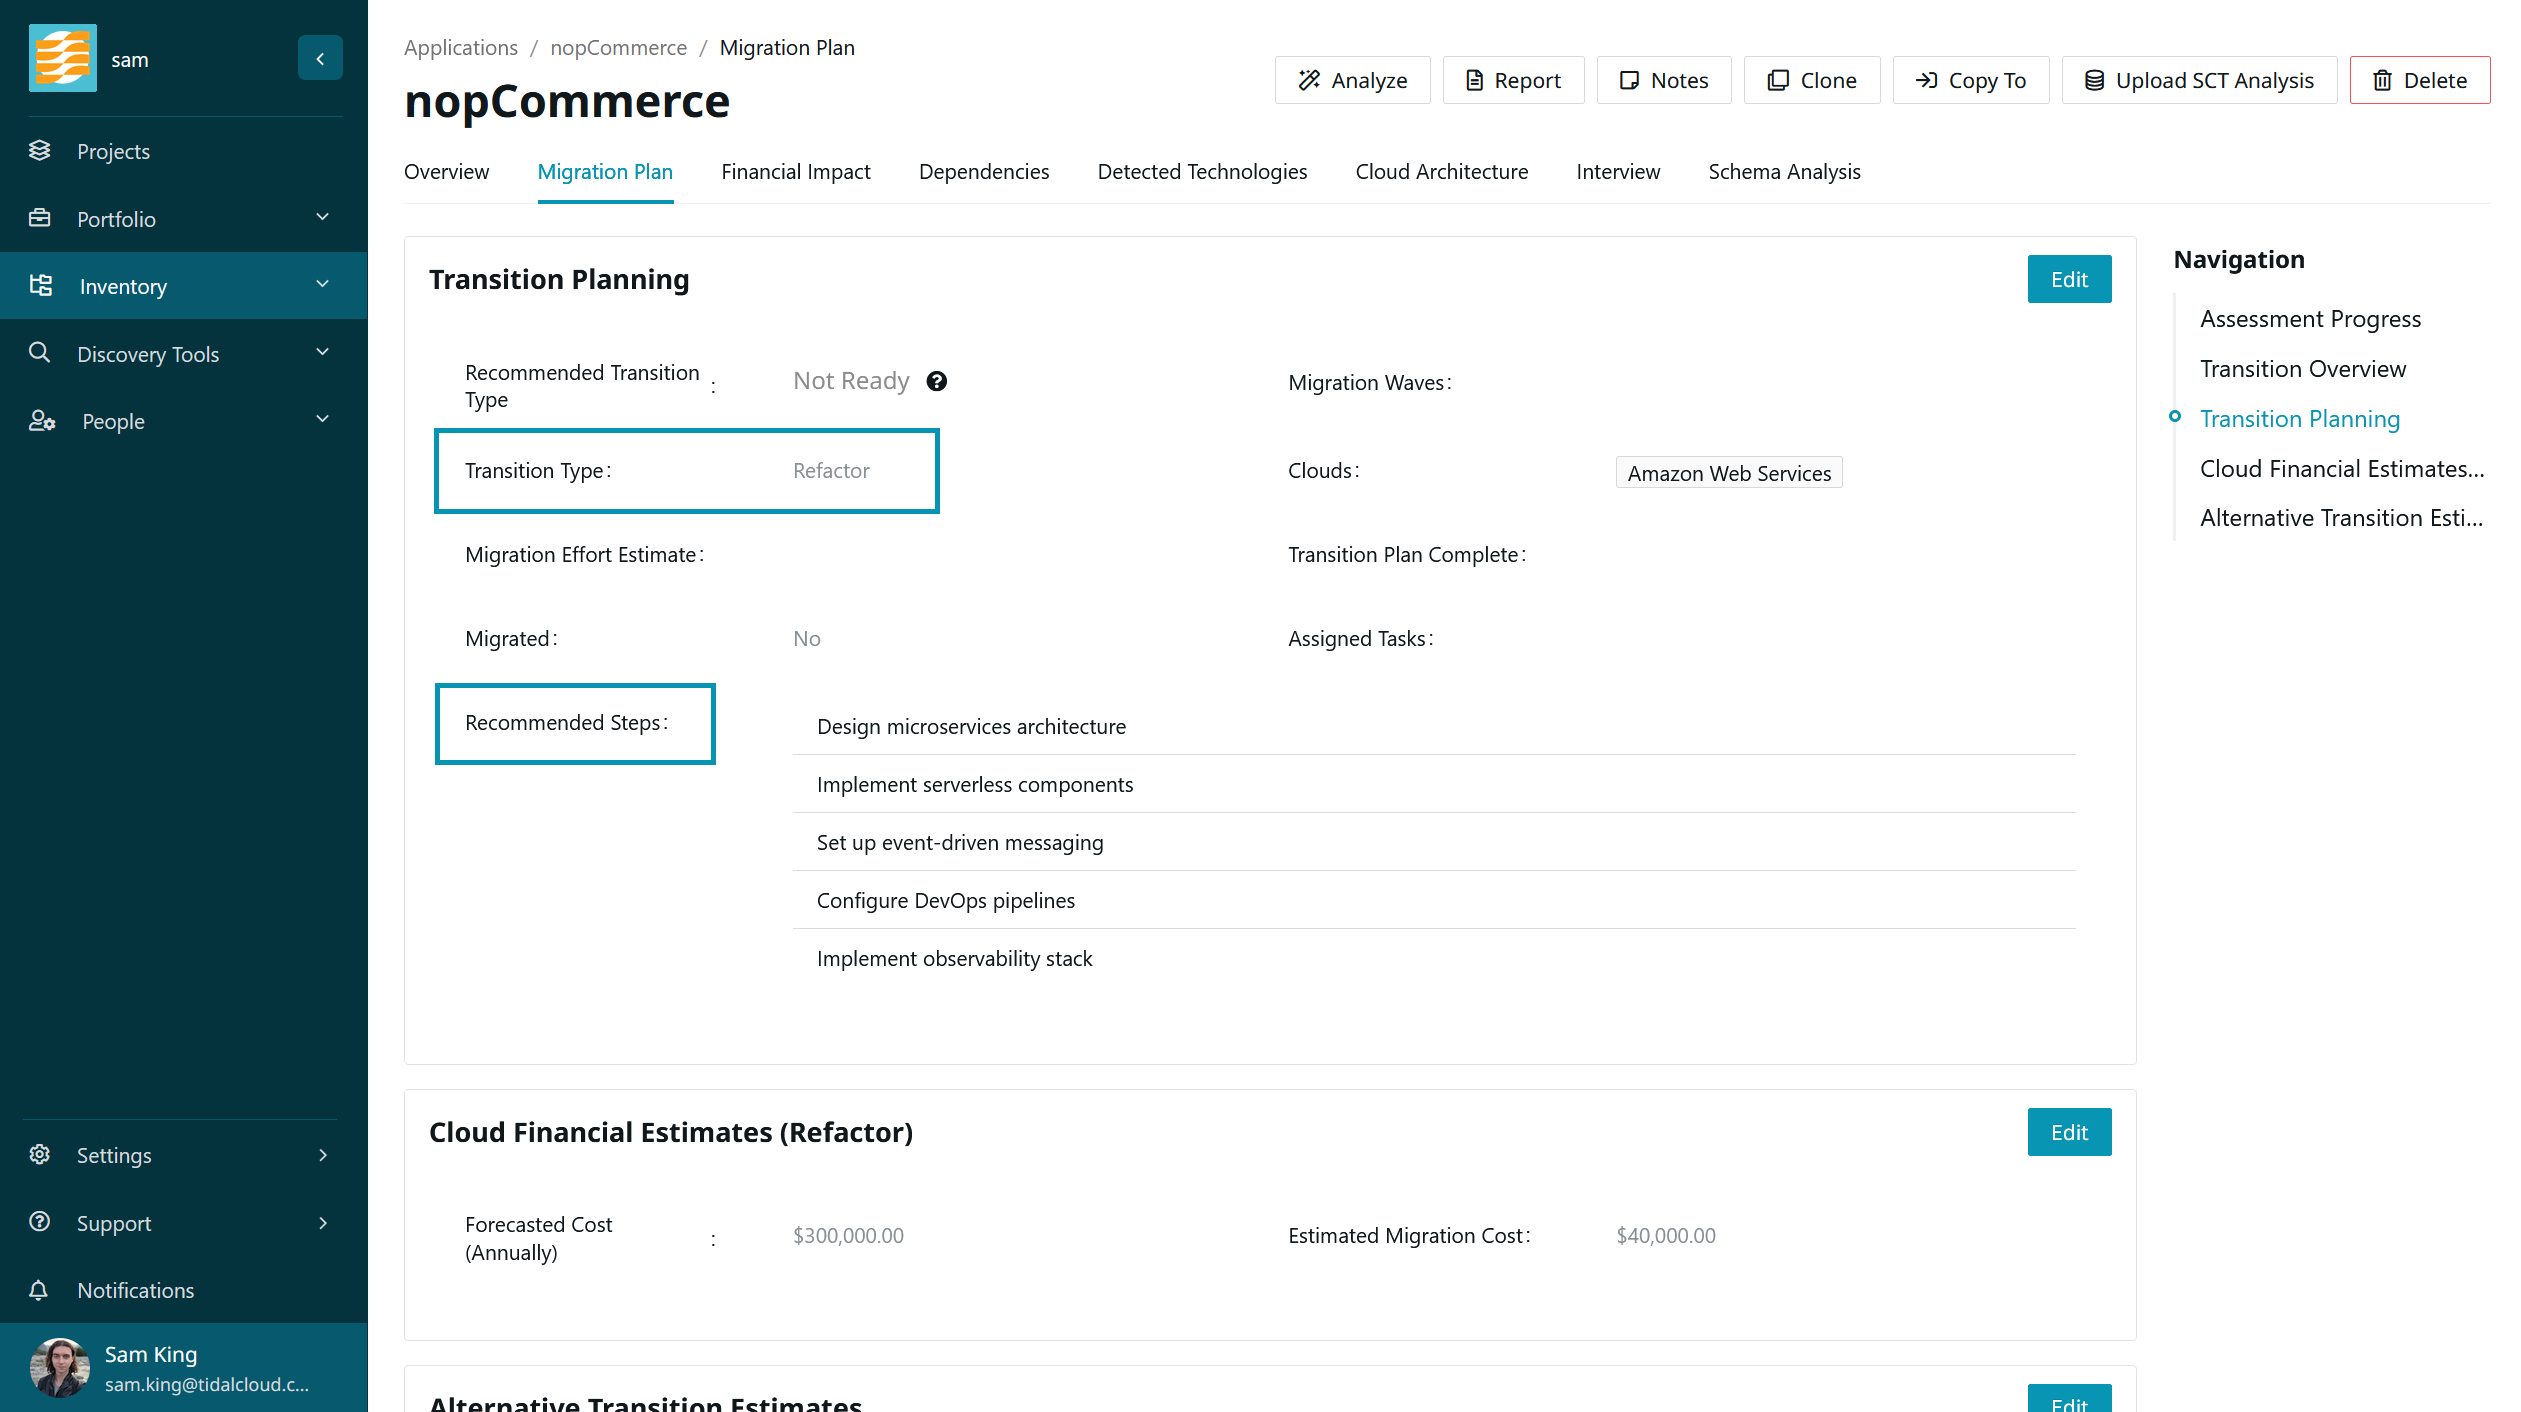
When you set a transition type of ‘refactor’, ‘rehost’, or ‘replatform’, we will automatically generate a series of recommended steps.
Step 8: Download the Modernization Presentation
Tidal Accelerator can create a comprehensive Modernization Assessment PowerPoint presentation using the data you have provided. This slide deck comes equipped with speaker notes to help guide your presentation.
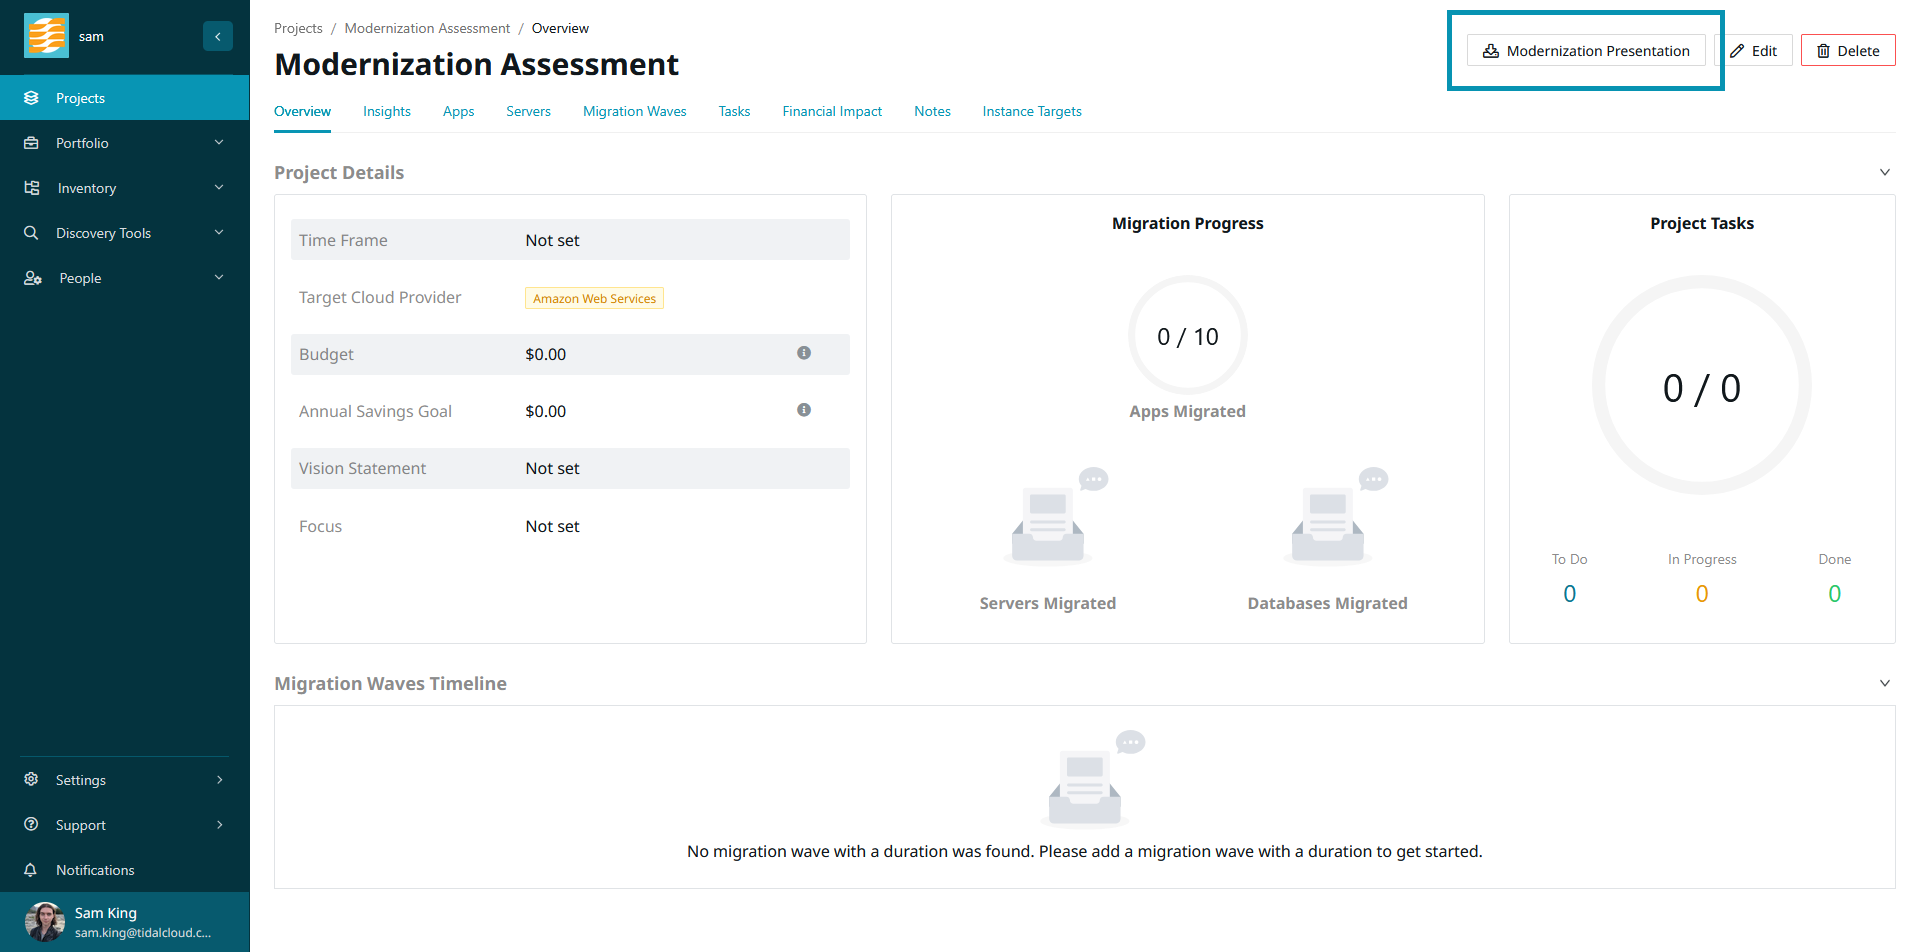
To download your presentation, navigate to the project and click ‘Modernization Presentation’.
Tidal Accelerator takes all the information provided so far and scores applications in the project based on three key factors: ease of modernization, business criticality, and ROI potential.
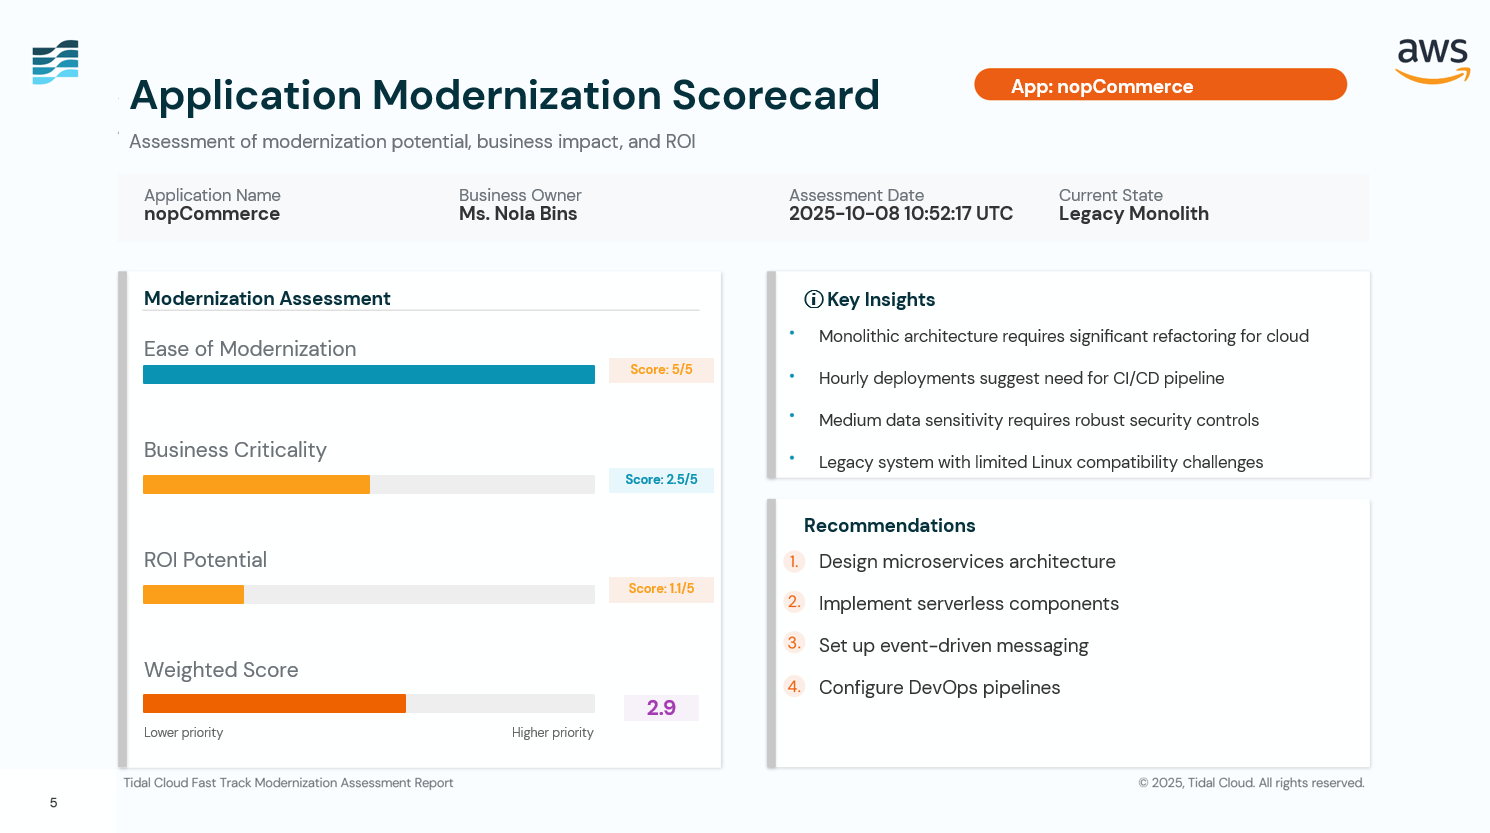
We use the weighted sum model to calculate the following values, as part of a proprietary algorithm developed over time with our experience of performing cloud modernization and migration. For more details about the specific data considered in this calculation, please refer to the information below.
Ease of Modernization
Ease of modernization is determined using the data obtained from performing source code analysis, as well as data on the application’s dependent servers and database instances.
Business Criticality
Business criticality is determined by data on the application record itself, such as ‘Person Hours Saved’ and ‘Revenue’, which can be found in the ‘Financial’ section of the application overview. These are included as default interview questions to ensure that this data is filled out. Note that if you set the ‘Regulated Requirements’ field to ‘Yes’, indicating that this application is required for the business by government regulation, the business criticality of this application will be set to the highest value (5).
ROI Potential
ROI potential is calculated by looking at the application’s current cost, based on ‘Annual Hosting Costs’ and ‘Annual Staff Costs’ in the ‘Financial’ section of the application overview. We then look at ‘Forecasted Cost’ and ‘Estimated Migration Cost’, found in the ‘Cloud Financial Estimates’ section of the application migration plan page.
Incidentally, this same data is used to generate many of the visuals found on the Financial Impact page, which can be viewed at both the application and project level.
Weighted Score
The weighted score is an average of the above three values.
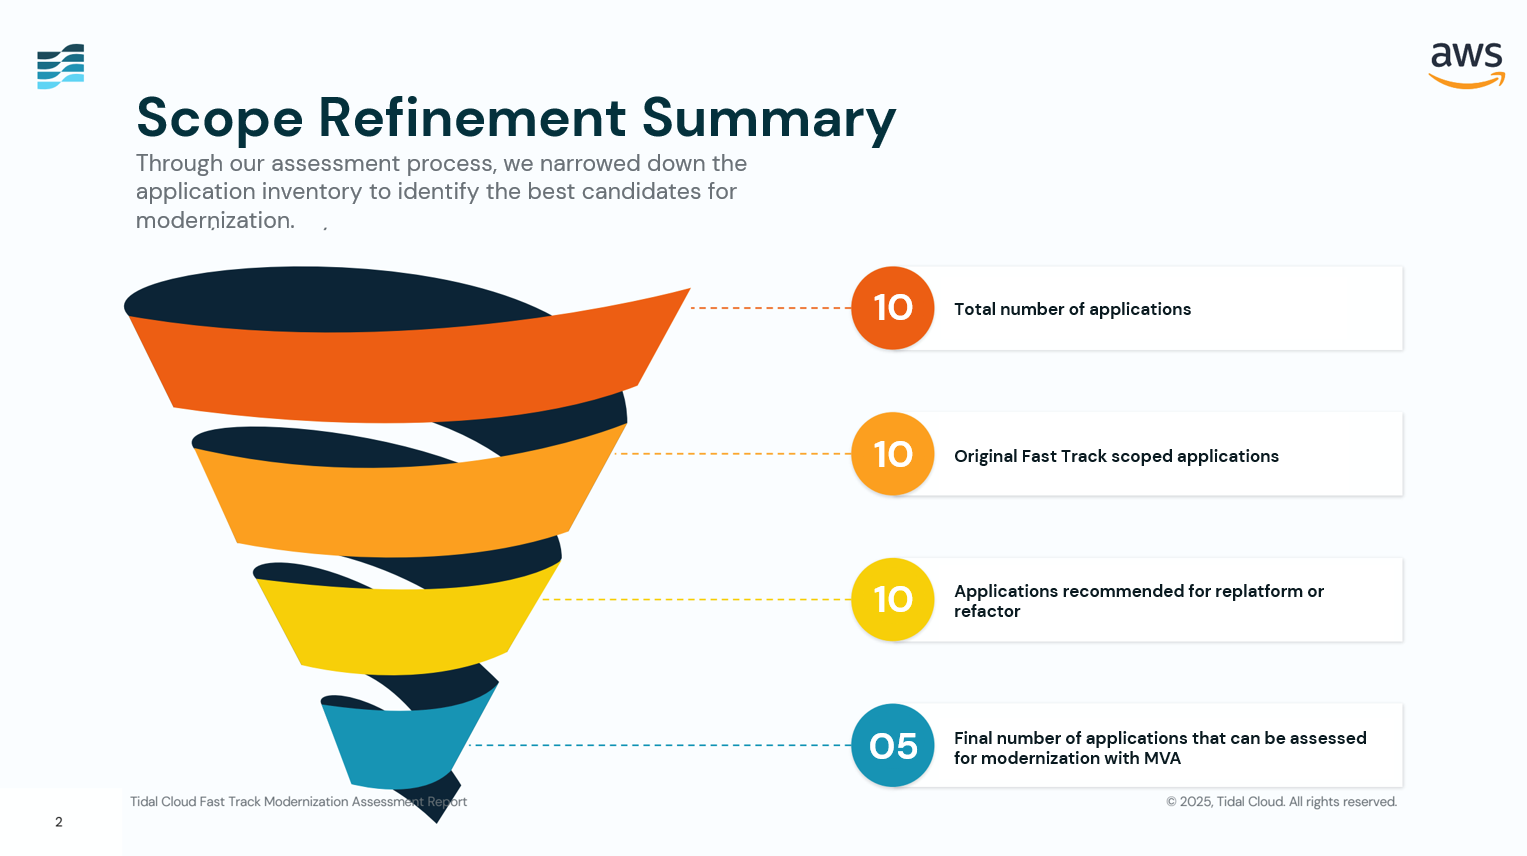
MVA Recommendation
Applications with a weighted score greater than three, that have a transition type of ‘refactor’ or ‘replatform’, and involve an element of Microsoft licensing are recommended for the MVA stage.
Whether an application has an element of Microsoft licensing is determined by examining the operating system of the application’s servers, the database engine of its database instances, and whether the application includes any Microsoft licensing cost data.
The Scope Refinement Summary slide in the presentation illustrates the process of narrowing down applications in scope, with the final number indicating the number of applications recommended for the MVA stage.